The Content Debugger Tab
- DEVOPS
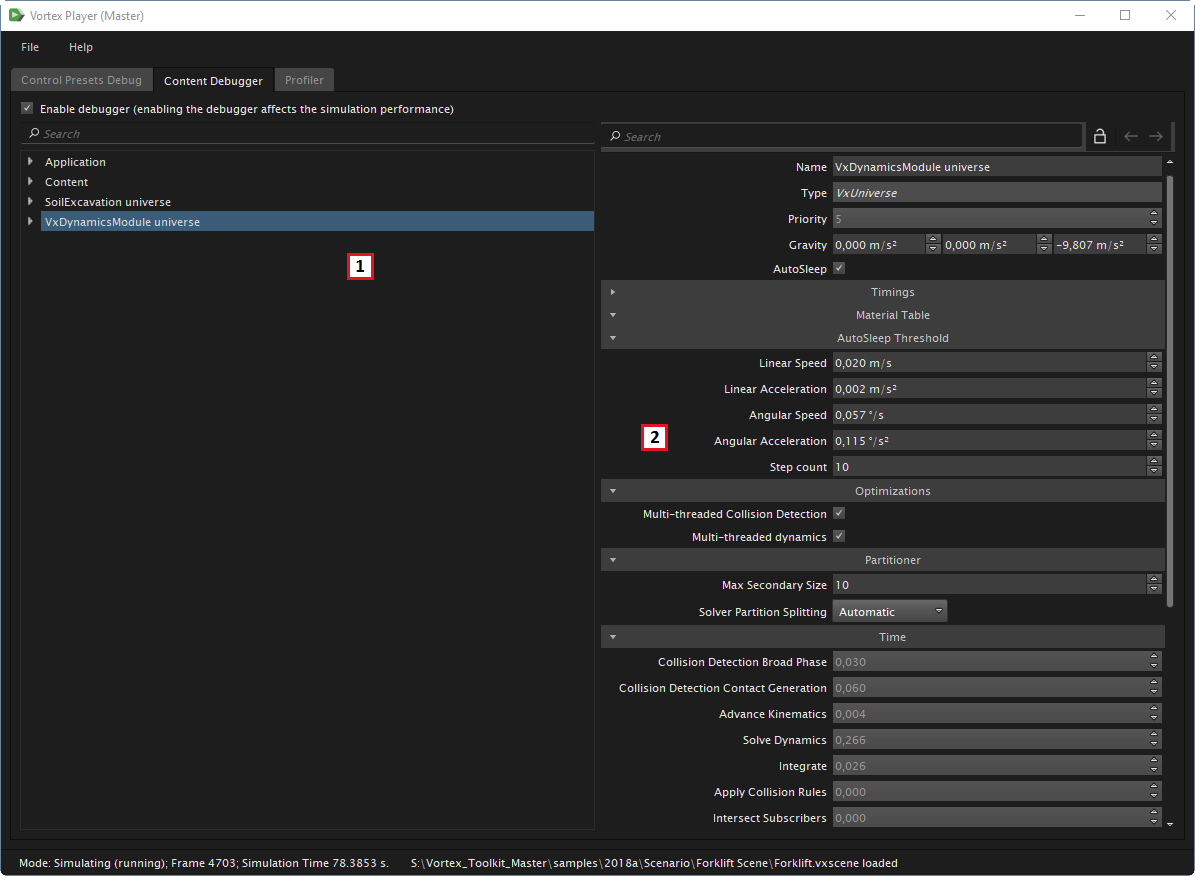
- Hierarchical view of objects in the application. On the Master, the universe(s) are also displayed.
- Editable properties of the selected object.
This Content Debugger lists runtime objects so you can browse through the objects and be able to see live properties of those objects. It is also possible to modify some of the properties at runtime.
Using the Content Debugger in the Vortex Studio Player
To use the functionality of the Content Debugger, you must first activate it by selecting Enable debugger in the Vortex Studio Player. Activating the Content Debugger affects the simulation's performance.
At the top of each pane is a filter in which you can enter words to limit what is shown in the underlying pane. For example, typing "box" and pressing Enter would only show you the objects with "Box" in their name and their position in the hierarchy.
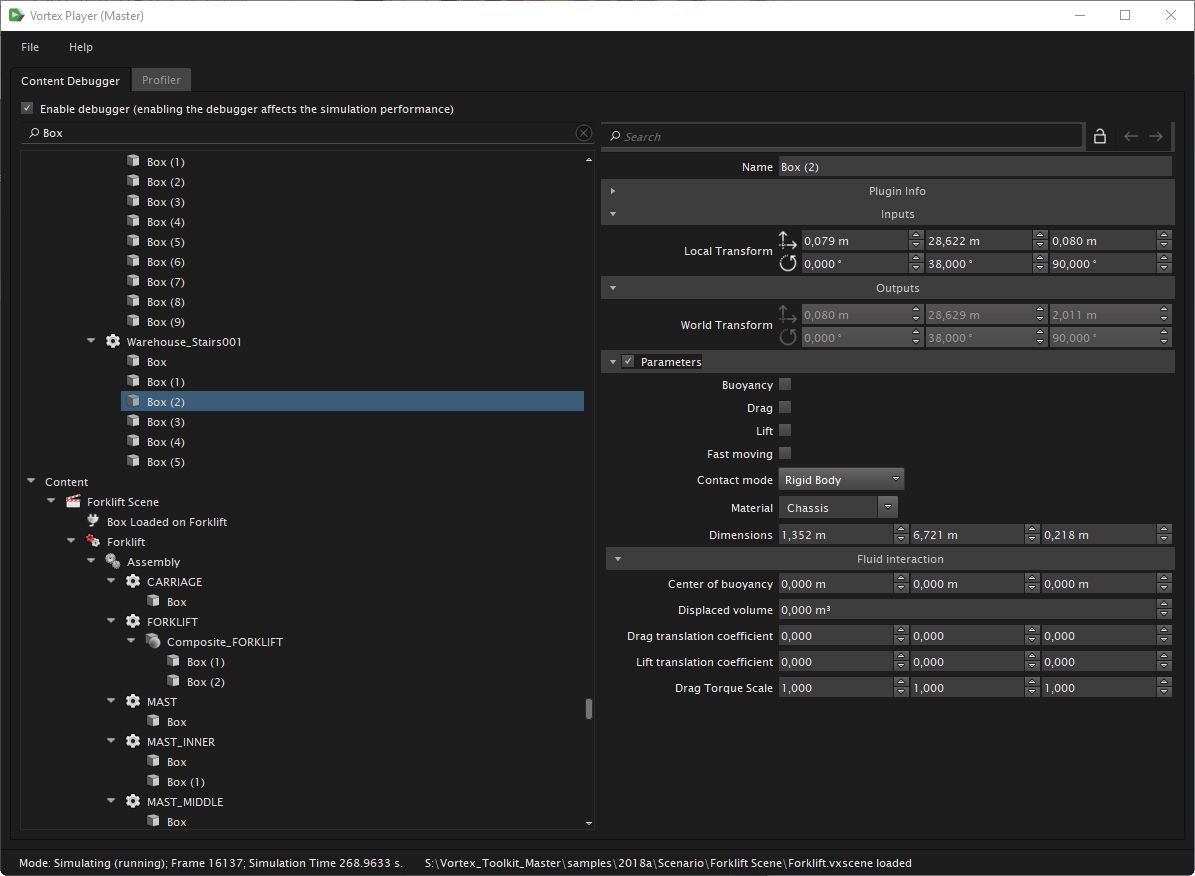
You can directly modify inputs and parameters in this pane, and the new values immediately affect the simulation.