The Network Processes Tab
- DEVOPS
Overview
The Master node represents the node where the dynamics engine is running. This is the node broadcasting simulation information to the slave nodes.
A slave node is a node receiving the simulation data, often to render it in a 3D scene with the graphics module.
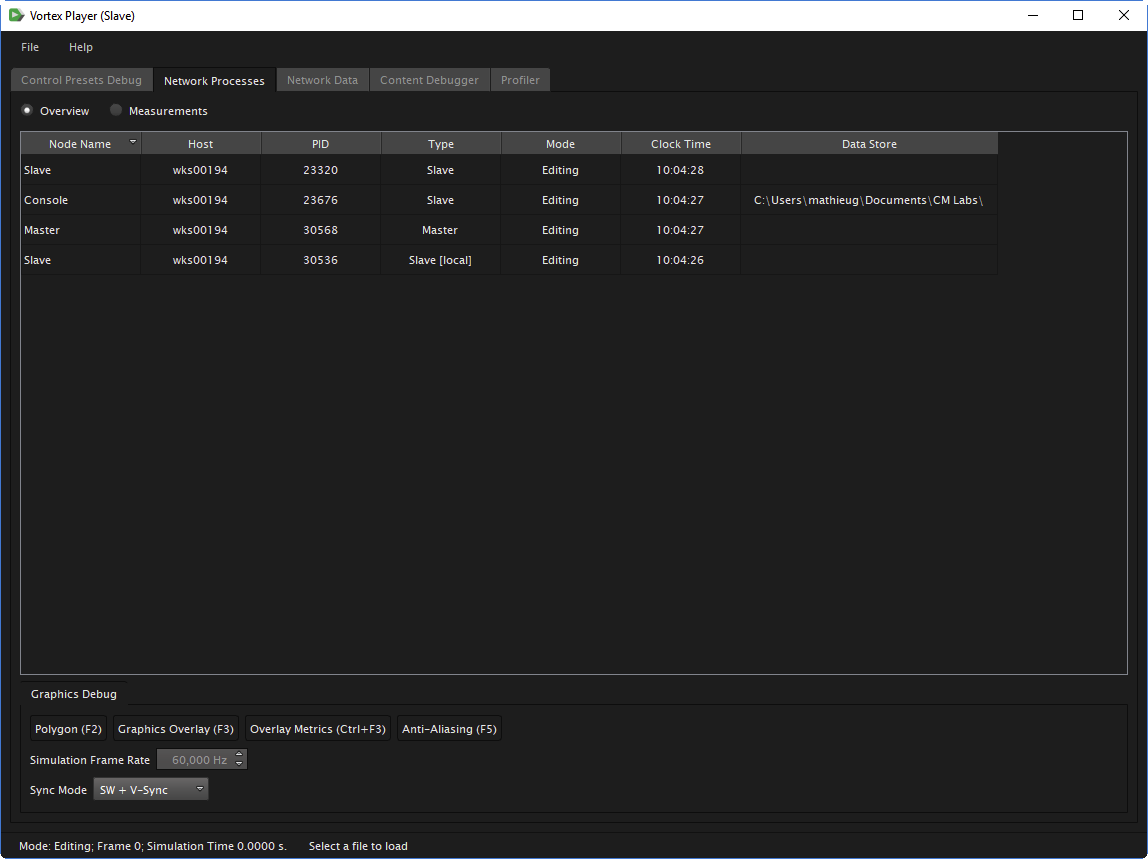
By default, the information is presented in Overview mode (see image above). Each line represents a SimApp process, i.e., one VxApplication configured with a node from the Setup file, running in the network with the following information:
- Node Name: Name of the node used to configure the application.
- Host: The machine's name.
- PID: Process ID.
- Type: Indicates whether this node is the master or a slave. If "local" appears after the type, this means it is the locally running process.
- Mode: The mode of the application running in the process, e.g., Editing, Simulating, Paused.
- Clock Time: Indicates the local time on that node.
- Data Store: The simulation uses files located on this computer in the given path.
Measurements
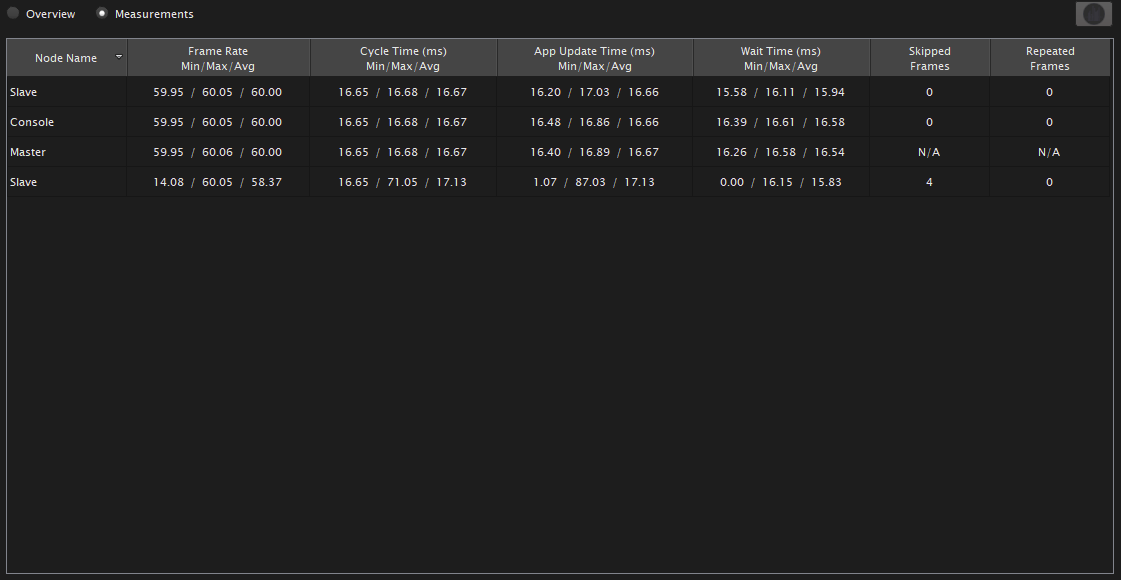
Clicking the Measurements button switches to a view mode where each line also represents a SimApp process running on the network, as in the Overview mode. However, information related to the processes measurements are shown here.
Note All min/max/average values are calculated from the last 120 frames.
- Frame Rate: Number of application frames per second.
- Cycle Time : Time taken by the application to update one frame (16.6 ms when running at 60 Hz).
- App Update Time: Time taken by the application update in one frame (this includes the Wait Time).
- Wait Time: Time that the application waits in one frame to reach the requested frame rate (this is only applicable if the SW Sync is activated on the application).
- Skipped Frames: Number of frames from the engine that were not processed and skipped on a slave process. This represents the total number of skipped frames over the last 120 frames.
- Repeated Frames: Number of frames from the engine that were repeated on a slave process. This represents the total number of repeated frames over the last 120 frames.
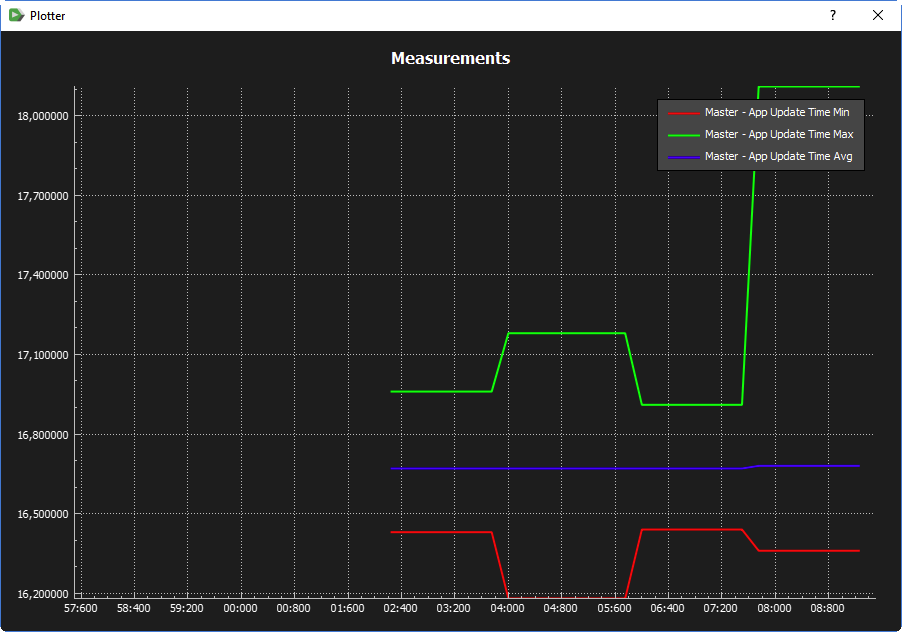
Plotting
Selecting a measurement activates the Plotter button at the top-right of the window. In this way, any measurement can be selected and plotted by pressing this button. To view multiple measurements at once on the same plot, multi-selection (by holding down the Shift or Ctrl keys) can be used to select more than one cell in the table.
Debugging
Below the node list is a Graphics Debug tab, providing the user with remote controls for all nodes containing a graphics module for the following:
- Polygon
- Graphics Overlay
- Overlay Metrics
- Anti-aliasing
- Simulation Frame Rate (only available in SW Sync mode)
- Sync Mode