Remote Debugger User Guide
- DEVOPS
This is especially useful if:
- You are a Vortex Studio user running simulations on another computer but debugging from your desktop.
- You build simulators in a setting where debugging on-site would accelerate bug finding and stabilization.
- You embed Vortex Studio software in your third party application using a Vortex High Level interface.
- You have a Vortex Studio SDK license and are using content in separate applications.
Tell Me About ... | How Do I... |
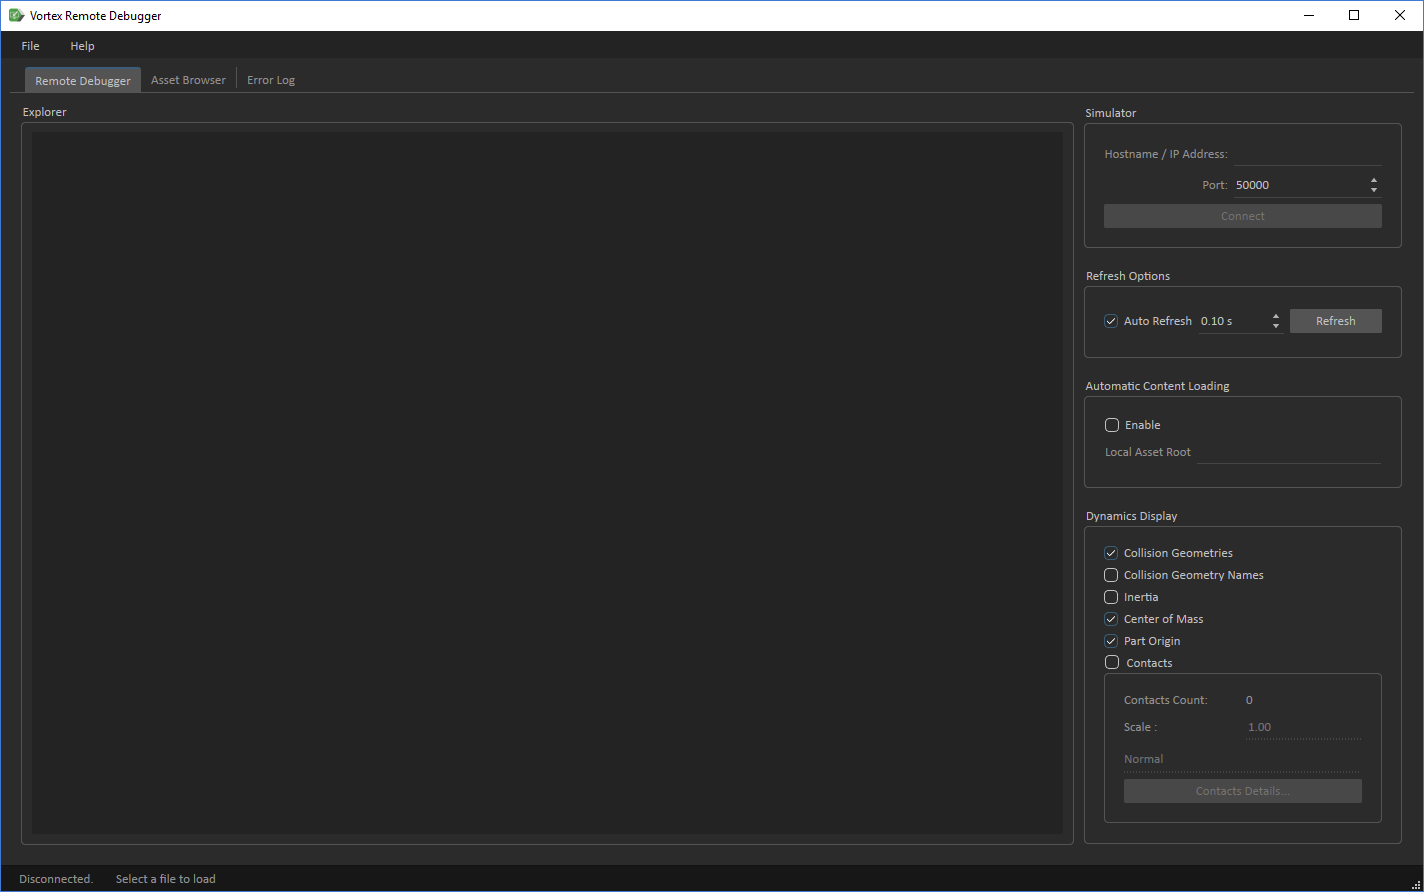
The Remote Debugger Application
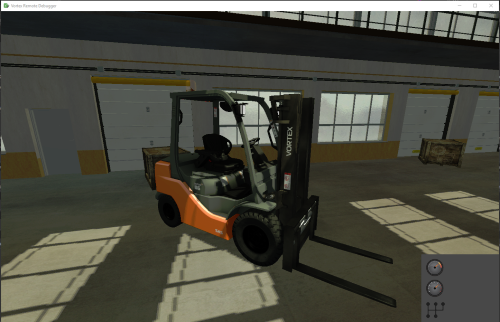
The Remote Debugger is a single process Vortex application. It includes a window for showing the simulation, a tab for browsing, and a tab for monitoring Error messages.
You can run the Remote Debugger application on one computer while your simulation runs on another. The application can be on a different network than the one your simulation runs on.
Specifically, you can use the remote debugger to diagnose problems with the following content:
- Parts, CGs, and kinematics
- Constraints
- Field values
- Contact information
- Cables
- Accessories
- Ocean
Starting the remote debugger
The remote debugger can be started from the shortcut on the desktop created during installation or the Windows Start menu.
Limitations
You cannot use the Remote Debugger 3D view to see the following:
- Earthworks Zone and Cables
- Animations (any output or parameters set using scripting, such as a Cherry light on the forklift
- The collision geometries of internal objects - only parts are displayed.
Setting up the Remote Debugger
Before you can use the Remote Debugger application, you must do the following:
- Customize Remote Debugger settings.
- Customize Dynamics Display settings.
- Prepare the simulation for remote access.
- Connect to the simulator from the Remote Debugger application.
Customizing Remote Debugger Settings
Like other Vortex Studio applications, the Remote Debugger has an application setup file.
The Remote debugger setup file is located at: C:\CM Labs\Vortex Studio [release]\resources\config\VortexRemoteDebugger.vxc
For convenience, options of the right-hand panel persist between sessions (except for the Dynamics Display options).
If you frequently need to debug a simulator at a set host with content that is always in the same directory, you can set the options manually in the Vortex Studio Editor. Specifically, you can customize the following settings:
| Setting | Description |
|---|---|
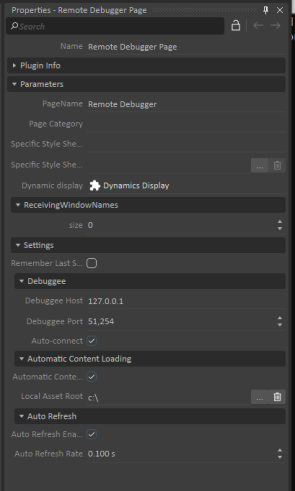
| Remember Last Setting | When selected, the debugger uses the last valid settings and ignored the Debuggee, Automatic Content Loading and Auto Refresh Settings. |
| Debuggee | Host: hostname or IP address of the process to debug Port: Port of the process to debug Auto-connect: When selected, the debugger connects to the process to debug without any user intervention |
| Automatic Content Loading | Enable: Automatic content loading is enabled Local asset root: Root folder from which the application automatically loads content |
| Auto Refresh | Enable: Auto refresh is enabled Auto refresh rate: Refresh rate when auto refresh is enabled |
IMPORTANT: If you save your setup file under a different name, you must update the Vortex Remote Debugger application with the new name of the setup file.
To set options manually, do the following:
- Open the content in the Vortex Studio Editor.
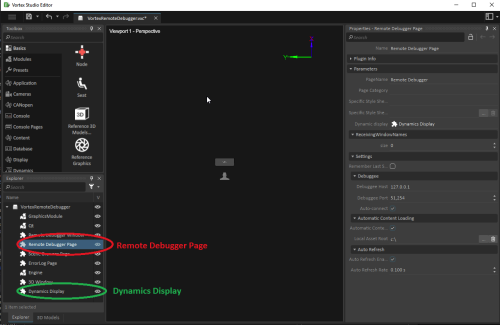
- In the Explorer panel, under VortexRemoteDebugger, click Remote Debugger Page.
- In the Property browser, under Parameters, in the section for Settings, click to deselect Remember Last Settings.
- Now, you can edit Debuggee (the object of your Debugging activities), Automatic Content Loading, and Auto Refresh Settings.
Customizing Dynamics Display Settings
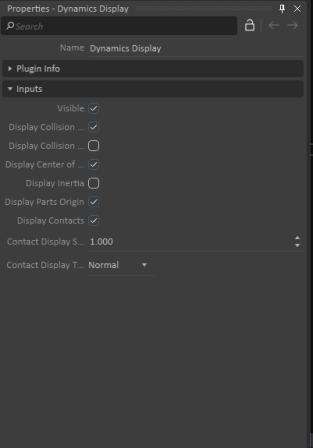
To customize the Dynamics Display views that appear in the Remote Debugger application, do the following:
- In the Explorer Panel, under VortexRemoteDebugger, select Dynamics Display.
- Click to select the Dynamics views you want to see in the Remote Debugger application.
Preparing the Simulation for Remote Access
Before you can use the Remote Debugger application, you must prepare your simulator system for remote access.
Enable Remote Access from the Vortex Studio Player
For simulator application that already has the Content Debugger, such as the Vortex Studio Player, you can enable Remote Access during runtime.
To enable remote access to the simulator from the Vortex Studio Player application, do the following:
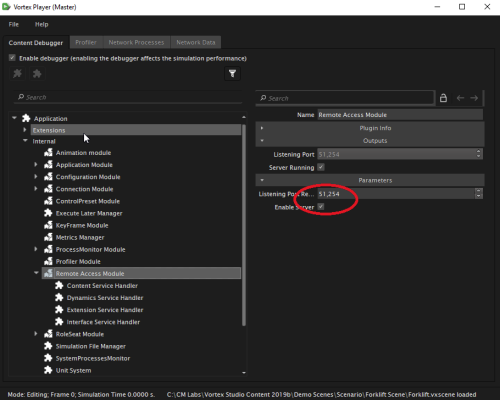
- Click the Content Debugger tab.
- Navigate to Application → Internal → Remote Access Module.
- In the Properties panel for the Remote Access Module, click to select Enable Server.
Enable Remote Access from the Vortex Studio Editor
To enable remote access, do the following:
- In the Vortex Studio Editor, open the Application setup document for the simulator you want to access remotely.
- In the Explore panel, click Setup.
- In the Properties panel for the Setup node, click to select Remote Access.
- (optional) Setup a listening port. (If the value in the field is 0, the system selects a port.)

Connecting to a Simulator from the Remote Debugger Application
To connect to a simulator from another computer using the Remote Debugger application, do the following:
- Open the Remote Debugger application.
- Make sure the Remote Debugger tab is selected.
- In the upper right, under Simulator type the hostname or IP address of the simulator you want to access and then type the Remote Access port number.
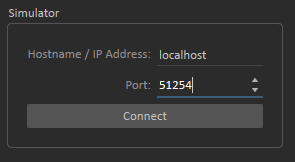
Hostname
To access a computer on a Fully Qualified Domain Name you must enter the IP address of the simulator you want to access. You cannot access a simulator on a Fully Qualified Domain Name using a hostname.
If you encounter some issues using localhost, try 127.0.0.1 or the IP address of the proper network you want to access.
- Review the information and click Connect.
Finding the Listening Port
If the port is set to 0, the simulator chooses a port at startup. To get the port number, you do one of the following:
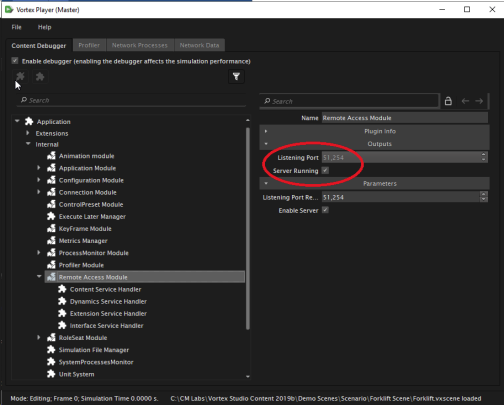
- If you are debugging a simulation in the Vortex Studio Player, go to Content Debugger Application → Internal → Remote Access Module. The port number is listed in the Properties panel under Output Listening Port.
- If you are debugging a simulator and do not have access to the Content Debugger application, you can find the port number in log files. Do the following:
- Open the Vortex Studio Director application.
- Select the Application tab.
- In the row for Master, click Log ...
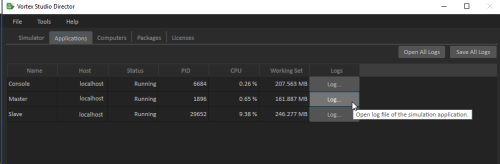
- Search for line that states the listening port. For example:
Thu Sep 26 07:57:03 2019 - INFO - VxSim::RemoteAccessManager: Remote Access server is listening on port 51254
Using the Remote Debugger Application to Debug your Simulation
The Remote Debugger has different panels and tabs that you can use to debug and troubleshoot problems in your simulation.
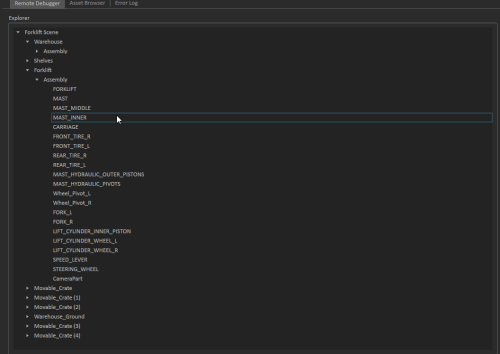
The Explorer Panel
Once connected, the Explorer panel lists all the mechanisms, assemblies and parts of the simulation.
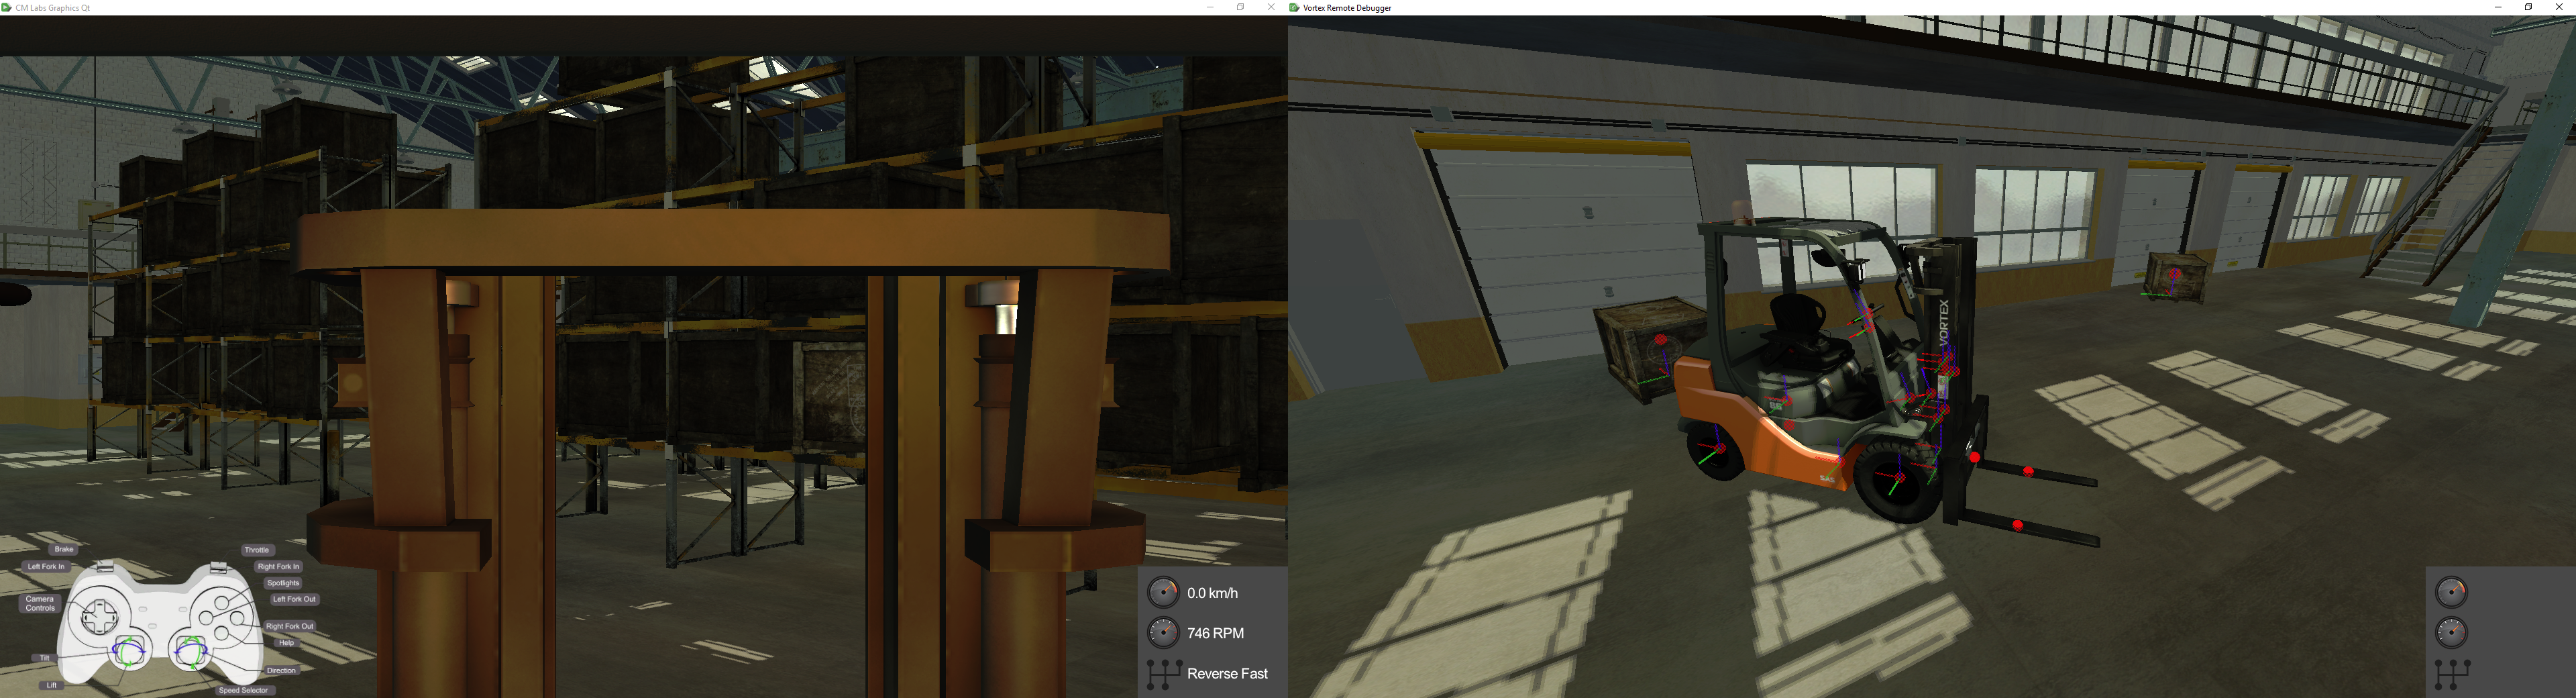
Visualizing Content in the Application
When the application is connected to the simulator, the 3D view window shows the simulation you are remotely connected to.
IMPORTANT: For the application to show information about your simulation content, the simulator must load the same content that you want to debug in the Remote Debugger. The Remote Debugger cannot show information about content that is not loaded on the simulator.
Setting Up Automatic Loading
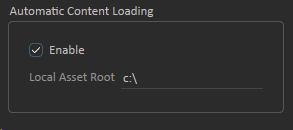
You can setup the Remote Debugger to automatically load the same content that is running on the simulator. FOr example, if the Vortex Studio Player is running a scene in C:\CM Labs\Vortex Studio Content 2019b\Demo Scenes\Scenario\Forklift Scene\Forklift.vxscene, the Remote Debugger will automatically load the same content.
To enable the application to load content automatically, go to Automatic Content Loading and click to select Enable. The local asset root must be set to c:\.
Loading Content in the Remote Debugger Application Manually
You can load and unload content while the Remote Debugger application is running.
To load content in the Remote Debugger application manually, do the following:
- Open the Remote Debugger Application and select the Asset Browser tab.
- Use the Add Assets buttons to add content files.
Any files that you add are displayed in the Asset Browser list. To load the content, double click on the file you want to see in the 3D view.
IMPORTANT: If your simulation is running on the Console (and not the Vortex Studio Player), the 3D view does not reflect the view of the simulation when you load the content manually. To visually debug content running on the Console application, you must enable Automatic Loading.
Refreshing Content
The Remote Debugger application does not run the simulator - it reads data from the simulator and replaces the objects in the view based on what it reads.
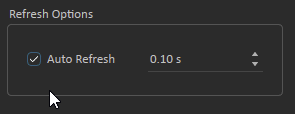
By default, the application refreshes automatically every 0.1 second, but you can customize how frequently the application refreshes with new data.
The Remote Debugger can negatively impact simulator performance because the data it collects during simulation is transmitted over the network, which places a burden on the simulator and the network.
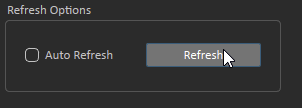
To stop the application from automatically refreshing, you can disable the Auto Refresh option. When Auto Refresh is disabled, you must click the Refresh button to update data.
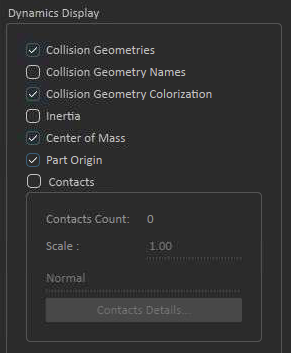
Dynamics Display
You can use different Dynamics views in the Remote Debugger application to see information about how dynamics are impacting the simulation. The Dynamics view shows the same options that you see in the Vortex Studio Player. For more information about Dynamics Display options, see: Dynamics Visualizer Tab.
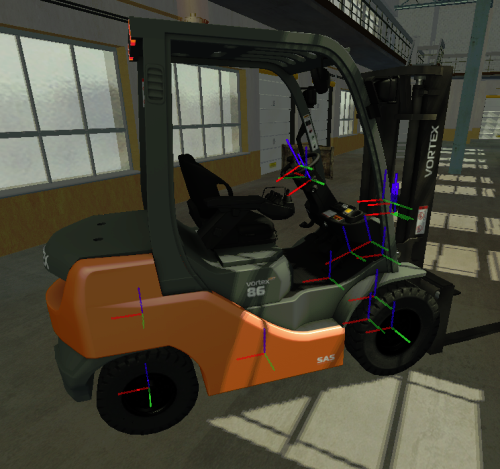
Display options