/
Measuring Performance Using the Content Debugger and Profiler
Measuring Performance Using the Content Debugger and Profiler
- DEVOPS
Owned by DEVOPS
Oct 05, 2021
Loading data...
Before reading this page, you should familiarize yourself with the use of the Vortex® Profiler and the Content Debugger.
Change the inputs and parameters of your objects and see how it affects the timings of the different sections of your application.
Examples
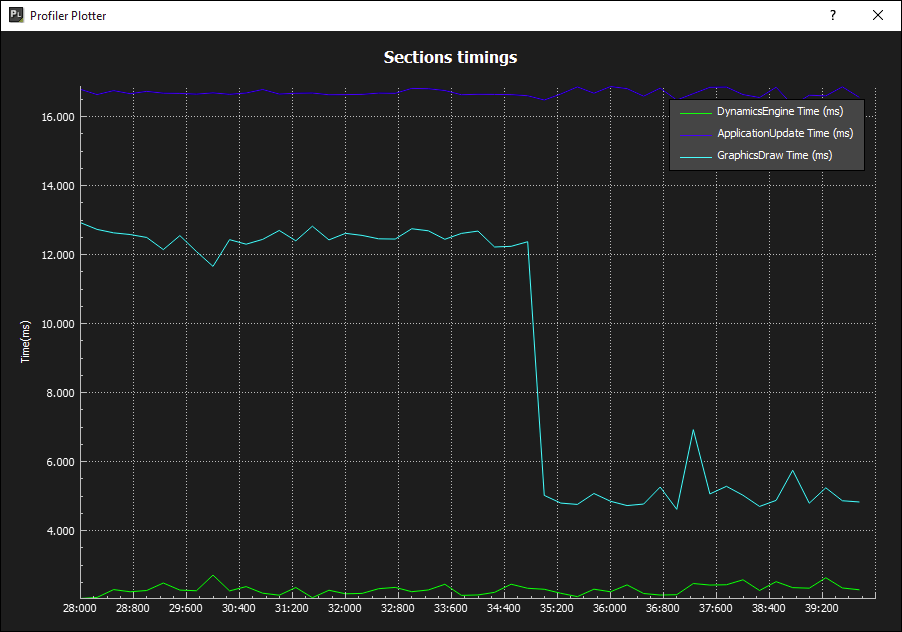
Disabling the Drawing of a Graphics Node to See the Impact on the Graphics Engine
- Open Vortex Studio Player (Standalone).
- Load the EOD demo scene.
- Start the simulation by pressing
 .
. - Within the Profiler tab, select Enable Tree.
- Expand ApplicationUpdate > GraphicsOSG > GraphicsDraw, right-click the value in the Time (ms) column, and select Show GraphicsDraw Time (ms).
- Do the same for DynamicsEngine and ApplicationUpdate for reference.
- Click
 .
.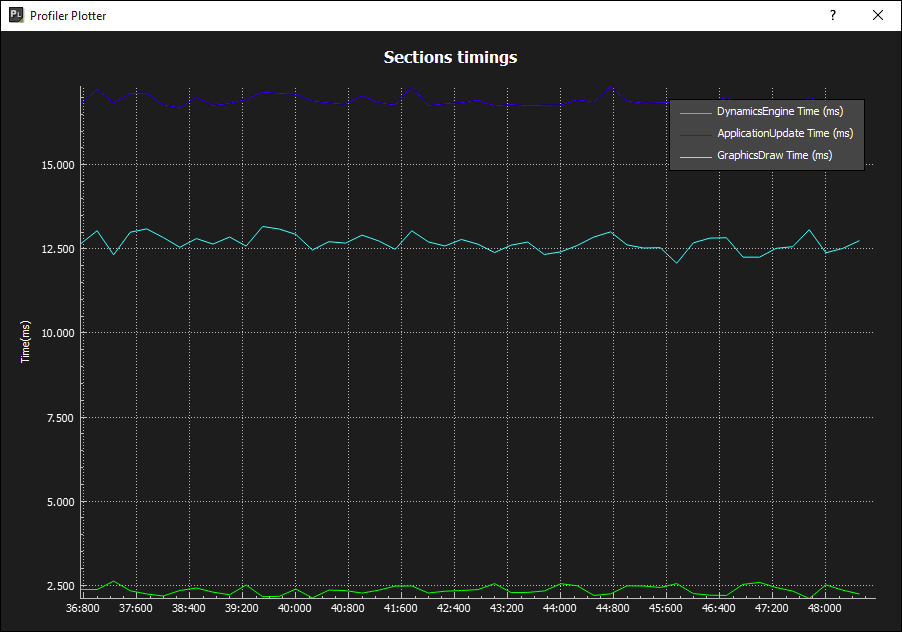
- Switch to the Content Debugger tab and select Enable debugger.
- In Content > Scene > Buildings > CityStreets > Background graphics node, deselect the Visible input.
- Observe the Profiler graph.
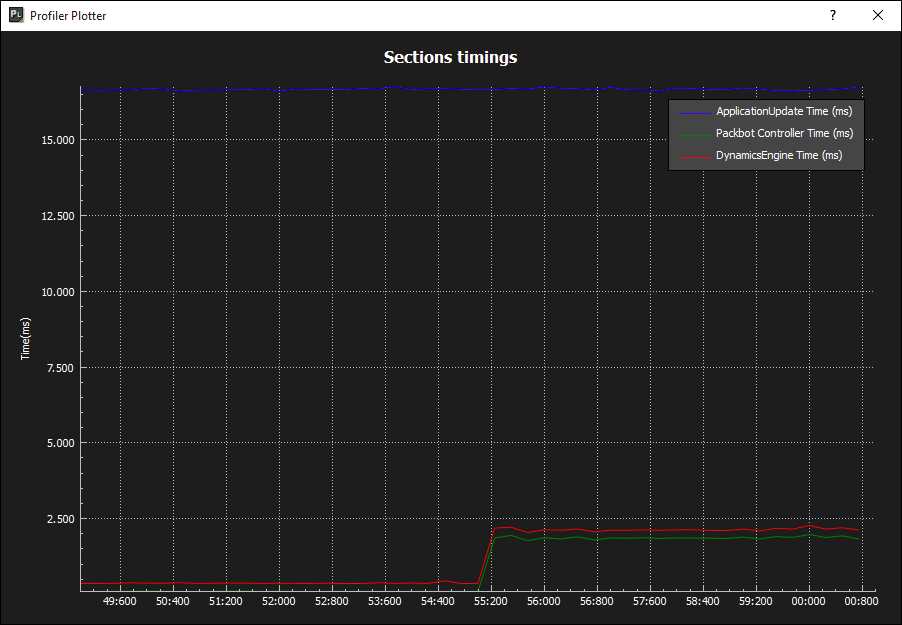
Modifying a Dynamics Python Script Extension to See the Effect on the Dynamics Engine
- Open Vortex Studio Player (Standalone).
- Load the
EOD.vxscenedemo scene found in your Vortex Studio Demo Scenes folder. - Start the simulation by pressing .
- Within the Profiler tab, select Enable Tree.
- Select Advanced Mode.
- Expand ApplicationUpdate > ModulesPreUpdate > DynamicsEngine > ExtensionPreStep > Scripting > Dynamics Python > Packbot 510 > Packbot Controller, right-click the value in the Time (ms) column, and select Show Packbot Controller Time (ms).
- Do the same for ApplicationUpdate and ApplicationUpdate > ModulesPreUpdate > DynamicsEngine for reference.
- Click .
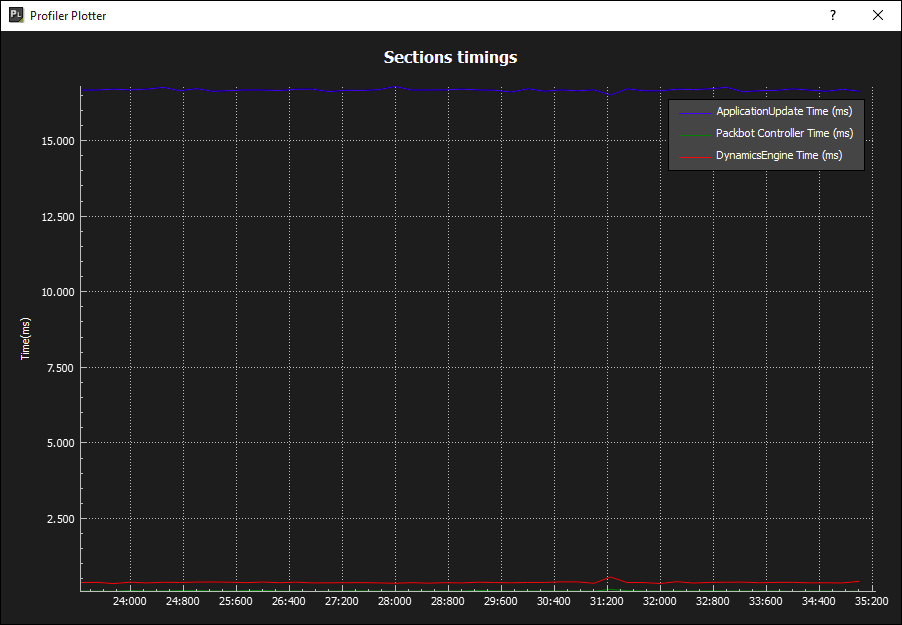
- Switch to the Content Debugger tab and select Enable debugger.
- Go to the Content > Scene > Packbot 510 > Packbot 510 > Packbot Controller script extension and edit the Code parameter.
At the start of the
pre_step()method, add the following code:Wasting time in the pre_step a = 0 for i in range(50000): a+=1
- Clock OK.
- Observe the Profiler graph.