Vortex Studio Player
- DEVOPS
 Vortex® Studio Player is a simulator application that allows you to load assets (either the Vortex Studio Demo Scenes that you installed or another Vortex Studio scene created with Vortex Studio Editor) and simulate them.
The simulation applications runs locally on the machine with one master process and two slave processes, one slave being used as a console and the other for graphics rendering.
The master process computes the dynamics simulation and distributes the simulation data required for the slaves to graphically render the results.
The console interface allows you to load simulation assets and simulate them; it also contains more pages for different features like key frames, recording, and controls.
The interface also contains profiling, debugging, and logging panels to be used when tuning or troubleshooting simulated content.

Installing the Vortex Studio Player
To install the Vortex® Studio Player, follow the instructions under Installation. If you have not installed the Vortex Studio Demo Scenes yet, you can install them using the same procedure.
Starting the Vortex Studio Player
You can start the Vortex Studio Player in the following two ways:
- From the desktop: Click on Vortex Studio Player (local) from the desktop or the start menu.
- Using the following command line argument:
VortexDirector.exe --launch ..\resources\config\player.vxsimulator
The Vortex Studio Director executable launches the simulation applications defined in the player.simulator file.
The Tray Icon
The Vortex Studio Player is launched by the Vortex Studio Director and the tray icon of the Director shows which applications are running.
For more information about configuring and monitoring a distributed simulation, see Vortex Studio Simulator User Guide.
Stopping the Vortex Studio Player
There are two methods to stop the Player. Each of them will close all application windows.
- Select Quit from the File menu of any application window.
- Close the main window to automatically shut down the other slave, the master and the console.
You can also use the Director windows if you want to force the Player to stop:
- Right-click on the Vortex Studio Player Director system tray icon and select Quit from the context menu.
- Double-click on the Vortex Studio Player Director system tray icon to show the Vortex Studio Player (Director) window, then select Quit from the File menu.
The Vortex Studio Player Interface
Application Windows
When you launch the Vortex® Studio Player, several windows appears:
- One window for each application:
- Vortex Studio Player (Console): The console is your control center, for starting and stopping the simulation.
- Vortex Studio Player (Master): The Master window contains debugging pages to troubleshoot issues related to the master.
- Vortex Studio Player (Slave): The Slave window contains debugging pages to troubleshoot issues related to the slave.
- The Graphics render window:
- Main Window (Window): This is where you see your simulation. If there is no content loaded, the window is blue.
Menus, Bars, and Tabs
You interact with the Vortex Studio Player through a series of menus and tabs along the top of the application, and a status bar along the bottom.
Menus
The menus are:
- File menu: Contains the Quit... option to exit Vortex Studio Player and shut down all the nodes.
- Help menu:
- View Help...: Accesses the online help via your default web browser.
- About Vortex Studio Player...: Shows information about the Vortex Studio Player.
- Start Vortex License Manager: Launches the Vortex License Manager.
Status Bar
The status bar shows the application mode, running or paused when simulating, the simulation time in seconds, and the current frame index. It also shows the last asset loaded, as seen in the following example.
![]()
Tabs
Each window has a different set of tabs, as indicated by the following table.
| Vortex Studio Player (Console) | Vortex Studio Player (Master) | Vortex Studio Player (Slave) | Standalone | |
|---|---|---|---|---|
|
|
|
|
Tabs appear along the top of the application windows:
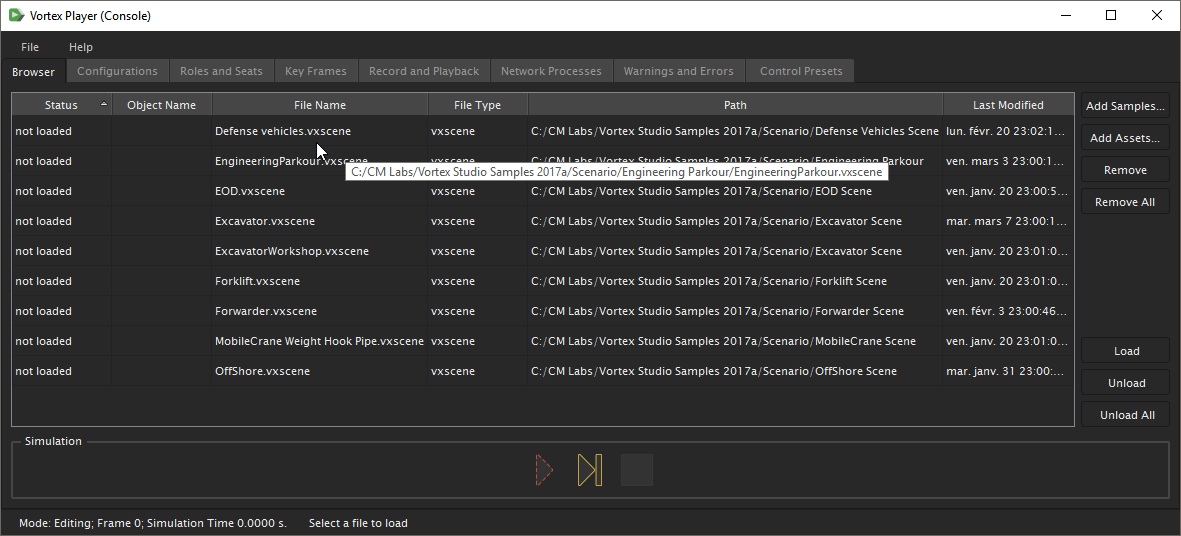
The Browser Tab
The Browser tab is where you can add and load assets to the Player and play them.
The Configurations Tab
The Configurations tab allows you activate and deactivate configurations that you may have set up for a scene or mechanism loaded in the Player.
The Roles and Seats Tab
The Roles and Seats tab of the Vortex® Studio Player allows you to assign available seats and roles to the simulation.
The Key Frames Tab
The Key Frames tab allows you to capture all application content data that is needed to allow the application to resume the simulation from that point.
The Record and Playback Tab
You can record and play back any Vortex®-based simulation by using the controls available on the Record and Playback tab.
The Network Processes Tab
The Network Processes tab in Vortex® Studio Player displays information about the processes running inside the simulation locally or on remote computers.
The Warning and Errors Tab
The Warning and Errors tab displays any error or warnings that have occurred in the Player simulation.
The Control Presets Tab
The Control Presets tab allows you to create and edit device mapping presets.
The Content Debugger Tab
The Content Debugger is a graphical representation of runtime objects available in the Vortex® Studio Player application.
The Profiler Tab
The Profiler tab allows you to view information about the resources that the simulation is using in real-time.
The Network Data Tab
The Network Data tab in Vortex® Studio Player monitors the data and the events sent or received from a given node in the simulation.
The USB Tab
The USB tab allows you to assign USB controllers to their associated extensions.
The Dynamics Visualizer Tab
The Dynamics Visualizer tab on the Player interface shows options for that you can use to show information about dynamics entities in your simulation, such as CGs, constraints, and more.