The Network Data Tab
Used in conjunction with the Profiler timings, this page helps troubleshooting performance issues in a distributed simulation.
At the top of the page, select the Enable Monitor option, otherwise the Events and Data tabs will not be updated.
The tab is divided into the following panes:
Status
The Status tab provides a general overview of network communications. This pane updates even if the Enable Monitor box is not selected.

All channels should be "alive", and the number of event sources should match the number of nodes. When content is being loaded, the channels may not respond until everything is loaded.
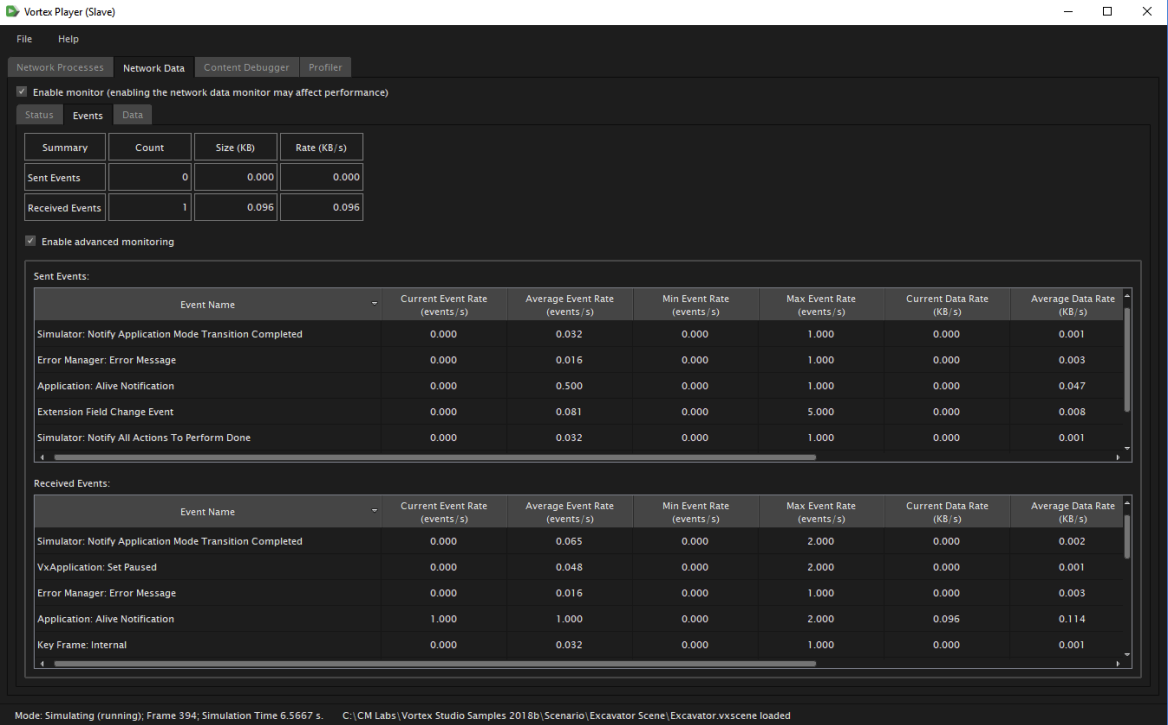
Events
In this pane, information about sent and received events is displayed in a detailed fashion. Such events are used internally to synchronize actions between nodes. User-created events will appear with the prefix "User Event:" before their names. The minimum, maximum and average data rates are also logged.
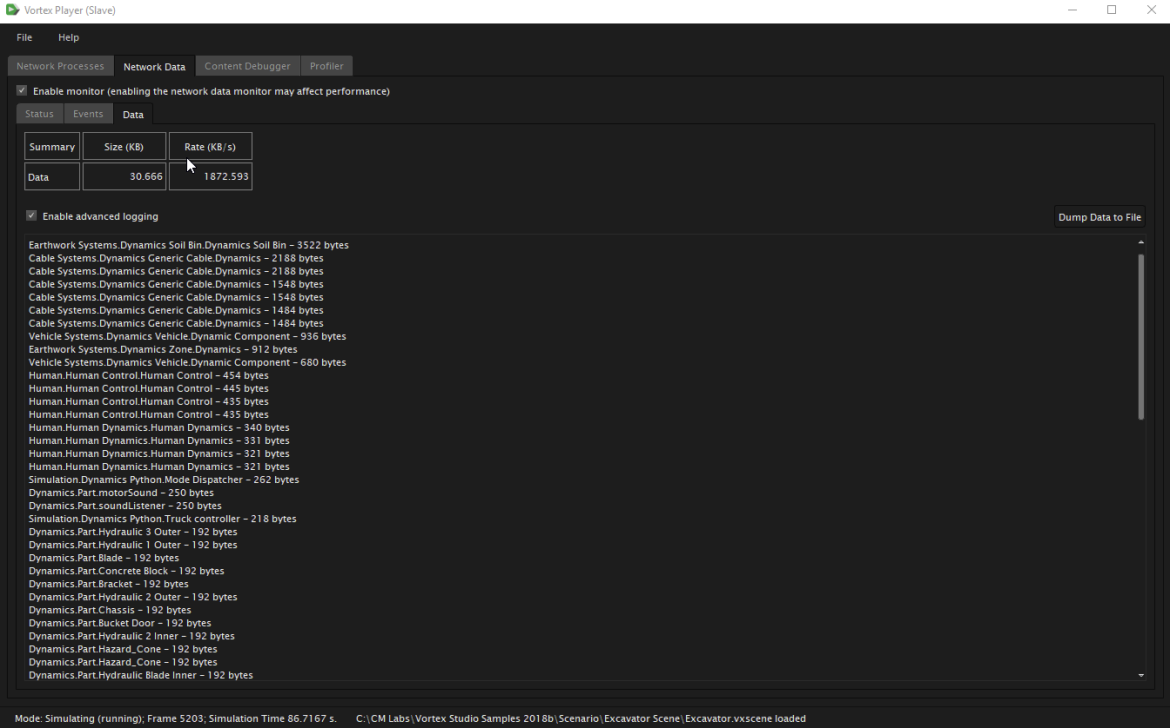
Data
Data is the amount of bytes sent by the extensions for the simulation. If you are monitoring a master node, the data corresponds to the values modified on the master broadcast to the slave nodes. If you are monitoring a slave node, the data corresponds to the values received from the master to update the slave.
Selecting the Enable Advanced Logging option displays more information about extensions and their associated cost.