The Profiler Tab
- DEVOPS
A simulation should be monitored regularly when adding or integrating new content, and changing values, in order to minimize regression testing of performance.
Any change in content can have an impact on the simulation frame rate, therefore all stakeholders must validate their changes with regard to the performance. The following list displays examples of stakeholders and when they should profile a simulation:
- Mechanical engineer: When developing a new mechanism or adding more functionality to an existing one, and verifying its impact on the simulation frame rate.
- Level designer: When adding more content or scripts, and verifying the impact of the changes on the simulation frame rate.
- Graphics designer: When creating or adding more content to a Graphics Gallery and verifying the impact of the changes on the simulation frame rate.
- Integrator: When the simulation has a performance issue even if content design has been made correctly (e.g., integration issue, hardware issue, network topology, application setup).
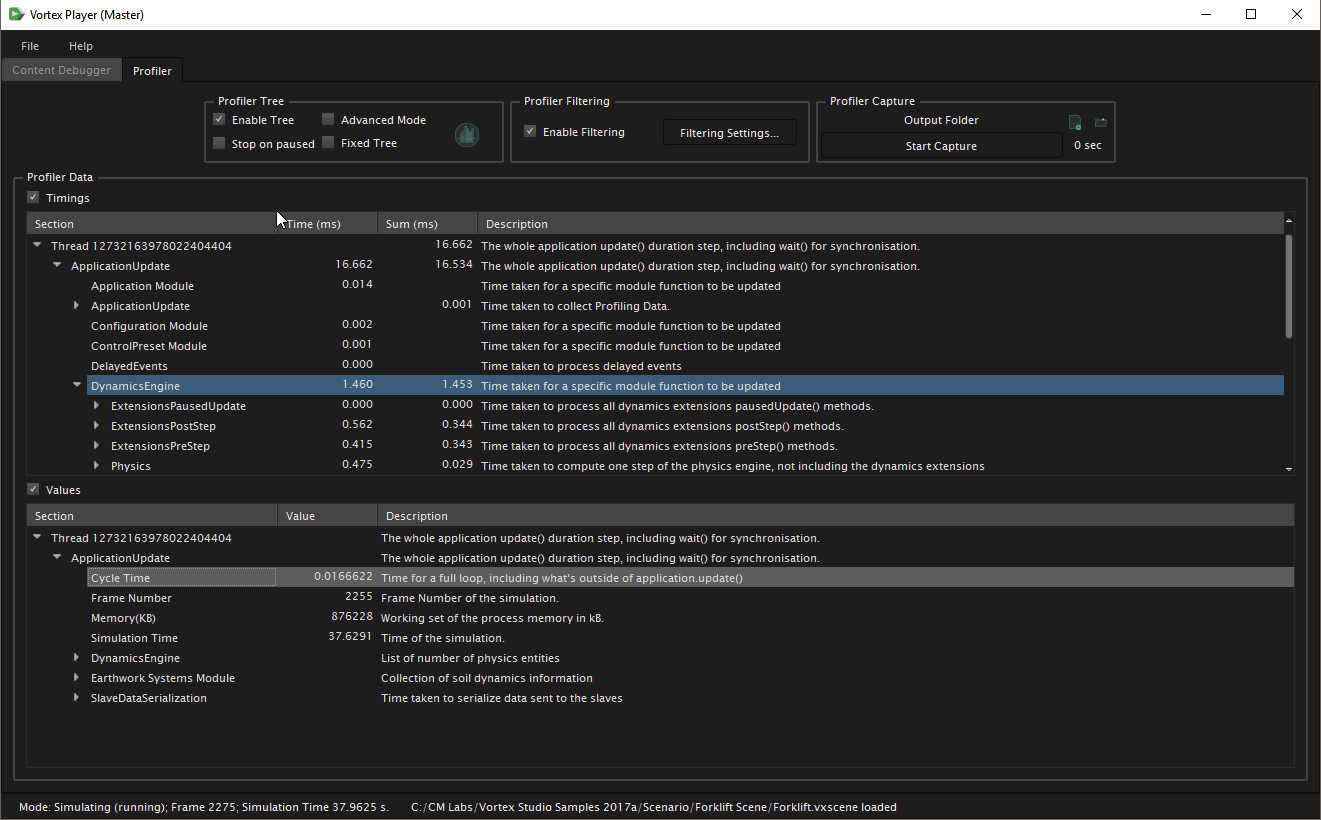
The Profiler is separated into four areas:
Profile Tree Panel
The Profile Tree panel contains these options:
- Enable Tree: Select this box to populate the Tree interface with the default, compact display mode. The preUpdate, update and postUpdate callbacks of each module are combined into one node to provide a quick view of the current performance.
- Advanced Mode: Selecting this box provides more details about the simulation, including all module callbacks, in the Tree interface.
- Stop on paused: Selecting this box prevents the Tree Interface from updating when the simulation is paused.
- Fixed Tree: Selecting this box prevents the Tree Interface from being rebuilt when new branches are added or removed. Instead, the new branches will not appear and the removed ones will no longer be updated.
Profiler Data Panel
Once the Enable Tree button is selected, the Profiler Data Panel populates its tree interface with real-time information about the simulation.
A tree interface is divided into two panes; each can be enabled independently. Only a single thread appears at first but clicking on the arrow to the left of the thread opens the tree to reveal sub-processes and their details.
The panes are:
- The Timings: Reports the time taken in each profiling section, as well as the sum of each sub-section. It shows the following columns:
- Section: Displays the name of the thread.
- Time (ms): Displays the time reported in a section.
- Sum (ms): Sum of the time reported by all the direct children of a section.
- Description: Description of what the posted time represents.
NoteThe time reported in a section is always greater or equal to the sum since the executed code is not completely covered by these reported times.
- The Values: Values recorded in each profiling section. It shows the following columns:
- Section: A leaf represents the name of a value, the branches are the sections containing the values.
- Value: Recorded value.
- Description: Meaning of the value.
Profiler Filtering Panel
To help reduce the amount of data profiled (e.g., to reduce profiling overhead or simplify the collected graph), the Profile Filtering panel contains the Enable Filtering option.
Note The Content and Dynamics categories are disabled by default. They contain the dynamics and content extensions timings (e.g., mechanism, assembly, parts, constraints, collision geometries).
To disable a category from being profiled:
- In the Profiler Data panel, select Enable Filtering.
- Click Filtering Settings....
- Select a category from the left-hand column, then click >. (To re-enable a category, select it from the right-hand column, then click <.)
- Select the desired sampling period for the Profiler.
- Click OK.
Enabling the following categories is useful when troubleshooting the listed extensions:
| Category | Description |
|---|---|
| Content | Scene, ConnectionContainer |
| Dynamics | Mechanism, Assembly, Part, Constraints, Collision Geometries Dynamics Extensions |
| Cable Systems | Cable Systems Dynamics Extensions |
| Earthwork Systems | Earthwork Systems Dynamics Extensions |
| Engine | Dynamics Engine (Solver) |
| GraphicsExtensions | IGraphics Extensions |
| Scripting | Script Dynamics Extensions |
| Vehicle Systems | Vehicle Systems Dynamics Extensions |
| Terrain Systems | Terrain Systems Dynamics Extensions |
Profiler Capture Panel
The Profiler Capture panel allows you to capture Profiler data on disk in a CSV file for a complete inspection. The Profiler saves all non-filtered extensions for the duration of the capture.
To capture Profiler data:
- Click
 to select the folder in which the CSV file will be saved.
 - In the Profiler Capture panel, click Start Capture.
- Click Stop Capture to end the recording.
Additionally, you can click ![]() to open the folder set in step 1.
to open the folder set in step 1.
The following is an example of CSV output with only Scripting enabled in the Filtering Settings.

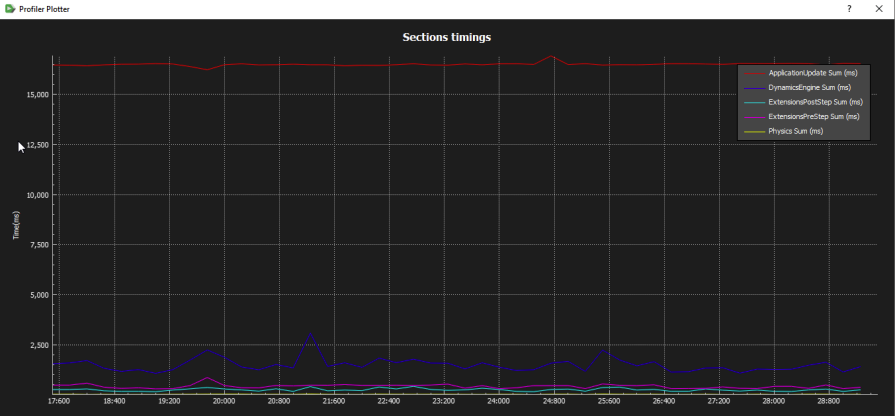
Profile Plotter
The Profiler Plotter graphs timings in order to study variations within actions, as well as identifying correlations between actions.
To plot actions:
- Click the Plotter button
 .
. - In the Tree interface, right-click on a time in the Time or Sum column in the Timings section.
- Select the resulting Show option. The graph of that action's timing appears in the Plotter.