Exercise Reports
Introduction
After each training session is done, the Console can be used to generated a report containing all the metrics and the score of the training session.
| How to ... | |
|---|---|
| Setup the Console for using the database | Creating a Setup File for the Console Interface be sure to use the Database module in the Setup file. |
In the Console, an Instructor can generate reports for any sessions of any students in the Instructor page. A student can generate reports for their training sessions in the User page.
A typical report contains
- The Student and Instructor names, which exercise and equipment was used
- The final score and the score breakdown
- The value of all Metrics for the the duration of the training session
- Any special environmental conditions
- Any instructor comment added during or after the training session
Python 3 Installation for Exercise Reports
Generating Exercise Reports from the Console of a simulator requires a Python 3 interpreter and some additional packages to be installed.
Refer to Vortex Console Prerequisite - Python 3 Installation
Customizing the Reports
It is possible for a simulator integrator to customize the default appearance of the reports that are generated.
Customization is NOT for simulator end users : simulator admins, instructors, and students cannot customize the reports.
Integrators, Level designer, and developers can customize how the the reports will look when they are generated by the final clients.
Customizing the Report Logo
When an exercise report is generated following a training exercise, the CM Labs Vortex logo is displayed in the upper left corner by default. To use a customer's corporate logo, another image file can be specified.
Company logo file
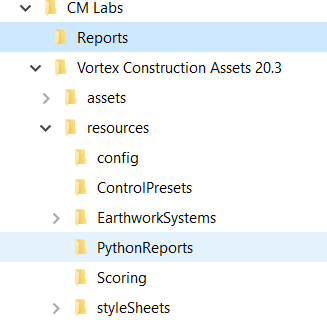
The image the system uses as the logo on reports is named companyLogo.png or companyLogo.svg and is stored in the directory C:\CM Labs\Reports (if your CM Labs installation is on C).
The system supports only PNG or SVG image formats. The PNG file format is preferred because not all features in the SVG file format are supported. However, if the SVG file format is chosen, we suggest using SVG v1.0.
Any image will be scaled to fit the report automatically.
To specify a new logo image file, do the following:
- Locate the logo file you want to use for reports. The file must be in png or svg format.
- Rename the file to companyLogo.png or companyLogo.svg (depending on the format of the image).
- Save the new logo in the C:\CM Labs\Reports folder.
Any reports generated should then display the new logo image. If no file is provided, the system uses the Vortex logo file saved in installation files.
Customizing the Display of Metrics in the Report Layout
Display of the exercise metrics is configurable on a per-scene basis. Each metric in the scene can be specified to appear in one of the following ways:
Metric final value at the end of the exercise, arranged in 2 columns
Optional pie chart composed of a few related metrics (e.g. collision types)
Plot of a metric's value throughout the exercise
Option to suppress metric display if information is not needed in the report
Configurations of metrics display are specified using JSON files
- One JSON file per scene, so each exercise using the same scene has its report configured the same way
- Simple syntax for specifying the display style for each metric in the scene
- Current default behavior is to show all metrics as plots
This feature requires a JSON file to be present for each scene in the following folder: <Assets Base Path>\..\resources\PythonReports with Assets Base Path as defined in the Console Module parameters. Note that the resources folder is at the same level as the assets base path folder.
Each JSON file must be named to exactly match the Display Name of the Exercise extension in the ExerciseList document. For example, use MySceneName.json to refer to the scene for which MySceneName appears in the Exercise file.
Sample file:
|
The first 3 entries in the file need to have the correct metric name entered on the right-hand side of the colon, for the number of completed goals, total number of goals, and total time, respectively.
To specify a Pie Chart in the "Pie Charts" section, list a number of related metrics which must be grouped into a single pie chart. Multiple pie charts may be specified by adding other groups of metrics enclosed with square brackets ([ and ]) within the "PieCharts" section.
The "MetricsInfo" section lists the metrics that belong to the scene. On the right-hand side of the colon, enter either "value", "piechart", "plot" or "none", according to the display type you want for each metric. If any metric is missing or misspelled, the default display type is "plot".
It is recommended to keep the contents of the "MetricsInfo" section in alphabetical order to make it easier to scan for a metric name, and to avoid duplicate entries. This is optional, as the order of the metrics is not significant.
If the file matching a scene name key is either missing or misspelled, the Reports software looks for a metricsconfig.json file. This serves as a default format for all exercises. If this file does not exist, there will be no top-level display of Total Time and Goals, and all metrics will be displayed as plots (including Total Time and Goals).
