Vehicle Tuning Guide
- DEVOPS
 This guide aims to help you with the techniques and procedures used to tune vehicles.
Depending on the application, certain vehicles might require more or less fidelity than is presented here, but this represents the best practices for a vehicle in order to achieve enough accuracy to feel like the real vehicle for most operators.
Along with this guide are two separate sections that focus specifically on how to create engine torque and engine braking tables (Engine Torque Table Tuning), and how to tune shifting points for automatic transmission vehicles (Automatic Transmission Shift Point Tuning).
Dependencies
This table describes which performance measures/tests are substantially influenced by which parameters. It primarily includes parameters and tests that have complicated interrelations, where tuning a single test is difficult without affecting other results. Parameters and tests that are not strongly interrelated are not included in the table, but are discussed later.
| Chassis | Drive Train | Suspension | Wheels/Tracks | Terrain | |||||||||||||
|---|---|---|---|---|---|---|---|---|---|---|---|---|---|---|---|---|---|
| Tests | Mass | CoM | Aerodynamic Drag | Torque | Max RPM | Gear Ratios | Shift Points | Friction | Efficiency | Height | Stiffness | Damping | Radius | Mass | Braking Torque | Friction | Rolling Resistance |
| Top Speeds (Governed) |  | | | ||||||||||||||
| Coasting | | | | | | ||||||||||||
| Acceleration | | | | | | | | | | ||||||||
| Braking | | | | | | ||||||||||||
| Top Speed (Power Limited) | | | | | | | | ||||||||||
| Creep Speed | | | | | | ||||||||||||
| Slope Climbing | | | | | | | | | | ||||||||
| Obstacle Traversal | | | | | | | |||||||||||
| Stability (Dive/Roll/Tip) | | | | | | | |||||||||||
Properties
Chassis
| Property | Description | Location to Set |
|---|---|---|
| Mass | Mass of chassis. This should be known from vehicle specs, but if not, must be estimated. | Mass of chassis part |
| CoM | Center of mass of chassis. This is sometimes known from specs, or can be derived from specs (for example, it can be calculated from relative weight on the front and rear axles). If not provided, it can be estimated from tests, like roll and tip stability. | Center of Mass of chassis part |
| Aerodynamic Drag | Drag due to aerodynamics resistance, generally stored as a coefficient of drag (Cd). This might be found in specs, but can also be estimated from the approximate shape of the vehicle. | Add fluid bodies to chassis part, or simple script to apply force to chassis part relative to velocity. |
Drive Train
| Property | Description | Location to Set |
|---|---|---|
| Torque | Torque table of engine. This should be found in a spec, most often as a complete curve, but a curve could be estimated from just individual values of max torque and max power. If not known, it could be estimated from an acceleration test. Details on creating a Vortex® torque table can be found in Engine Torque Table Tuning. | Torque Table CSV file |
| Max RPM | Maximum RPM of engine. This should be known. | Extracted from Torque Table CSV file |
| Gear Ratios | Ratios of each gear, and the ratio of the final drive (differential). These are generally known, but if not, they can be derived from the maximum speed in each gear. | Gear Ratios of Automatic Transmission |
| Shift Points | The RPM at which an automatic transmission shifts up or down. These are usually known, since they can be directly seen by an operator of the vehicle. If they are not know, they can be reasonably estimated using the procedure in Automatic Transmission Shift Point Tuning. While the shift points will have an effect on acceleration and coasting behavior, it is usually preferred to fix them from known values, and not modify them to change the tuning. | Gear Change Table CSV file |
| Friction | Power loss in drive train due to friction. This represents friction in things like wheel bearings, which are related to velocity but not transmitted power, so it is expressed as a function of speed of the rotating component. This is rarely known accurately, so it is tuned based on measured performance. | Damping Exponential Damping parameters. Exponential function might not be appropriate, so exponent could be set to zero, and a script used to dynamically update damping based on other information. |
| Efficiency | This represents how much of the power of the engine is lost in things like transmissions and differentials, which is proportional to the power transmitted. It can be approximately modeled simply be reducing the engine torque by a constant factor. | Engine torque can be reduced with Engine Torque Scale, or by reducing values in Torque Table CSV file. |
Suspension
| Property | Description | Location to Set |
|---|---|---|
| Height | Height of suspension system, which is tuned as the starting offset in the suspension spring. This is generally tuned based on the graphical model or pictures. The graphical model is generally set to be the rest state of the vehicle, which means suspension height (preload) should result in the chassis staying at the initial height of the graphical model, rather than settling down when starting the simulation. | Default height is set in Reference Point; Suspension Highest Point and Suspension Lowest Point also set min and max limits. |
| Stiffness | Stiffness of spring element of suspension system. This is sometimes provided as a spec, but if not, it must be estimated using tests like body roll. | Suspension Stiffness |
| Damping | Damping of suspension system. A spec is sometimes provided. If not, this can be estimated to result in a somewhat overdamped system, which means it could be between 0.2 to 0.4 times the stiffness. | Suspension Damping |
| Radius | Radius of wheels. This should be known. If possible, this should be the rolling radius of the wheel, rather than the physical radius. | Radius |
Wheels/Tracks
| Property | Description | Location to Set |
|---|---|---|
| Mass | Mass of wheels, sprocket, idler, and track. If not known, they must be estimated. They will have a similar effect as chassis mass on vehicle behavior, so it might not be possible to independently derive these values from tests. | Mass property of each wheel or track element |
| Steering Angle (Wheels) | Maximum allowed angle of steered wheels. This is sometimes known, but even if it is, this number must tuned to provide the correct turning radius, so actual tuning might differ slightly from the provided spec. | Steering Ackerman Max Angle |
| Speed Ratio (Tracks) | Maximum ratio of speed between left and right tracks. Might be known, but should be tuned to provide correct turning radius and pivot steering speed. | Steering Table and Pivot Table CSV files |
| Braking Torque | Maximum torque of braking system. This is sometimes known from specs, but if not, it can be tuned based on other criteria, like whether the brakes should stop the vehicle with full throttle or on a slope. It can also be tuned to control the stopping distance (to some degree). | Maximum Brake Torque |
Terrain
| Property | Description | Location to Set |
|---|---|---|
| Friction | Friction of wheel or track with ground. This is usually known for tires on pavement (around 0.8m or 0.9), but must be estimated for other terrain types. Ultimately, a dry friction model isn't necessary suitable for soft terrains, so estimating is fairly approximate. | Friction coefficient of Linear Primary Axis and Linear Secondary Axis |
| Rolling Resistance | Rolling resistance of wheel or track passing over ground. This is generally 0 on hard ground (pavement, concrete), which means the effect is ignored since drive train damping will have the same effect. On soft ground, this should be tuned to provide reasonable top speeds or coasting deceleration rates. | Friction coefficient of Angular Primary Axis and Angular Secondary Axis |
Tests
Suspension Height
Most graphical models of vehicles show the position of the chassis and wheels when the vehicle is at rest, where the weight of the vehicle is already loaded on the suspension. This test is performed just by playing a simulation and seeing that the vehicle does not settle to a ride height that is different than the initial height of the graphical model.
Top Speeds (Governed)
Vehicle specs often include the highest speed achieved in each gear, which includes the top speed of the vehicle. These speeds are purely a kinematic relationship between the max RPM, gear ratios and wheel radius. In this case, the limit (governor) of the engine is the limiting factor for the speed.
Coasting
This is specified as the time taken to decelerate from a certain speed with no brakes applied. This deceleration can be calculated from force/mass, where the only relevant forces in this case are drive train friction, aerodynamic drag, and rolling resistance. If the test is performed with the transmission engaged, it also includes drive train friction.
Acceleration
This is usually measured by timing how long it takes for the vehicle to go from stopped to a certain speed. Since acceleration can be calculated from force/mass, it is primarily determined by the torque curve of the engine and mass of the chassis. Other effects, such as drive train friction and aerodynamic drag will reduce acceleration, as will additional masses and rotating inertias. In vehicles powerful enough to spin the tires, friction would also be a limiting factor, but that is mostly limited to sports cars.
Braking
This is specified as either the distance traveled or time taken while decelerating from a certain speed with full brakes. While certain drags have an effect, the braking happens in such a short time that they are mostly negligible. The braking process can happen in two ways, with or without the wheels locked. Braking behavior is mostly controlled by adjusting the maximum brake torque, but this doesn't have a lot of effect once the wheels lock during the test. At that point, the behavior is primarily determined by the friction of the terrain.
Top Speed (Power Limited)
In cases where the vehicle does not have enough torque to reach max RPM, the torque and drags on the vehicle will determine the maximum speed.
Creep Speed
This is the speed that a vehicle will move while the transmission is engaged, and no throttle or brake is applied.
Slope Climbing
Slope climbing ability could be limited by stability of the vehicle (dimensions and center of mass), which would cause it to tip over on large slopes. If the wheels slip on the slope, it is limited by friction between tires and terrain, and this is the sole factor that has an effect. It could also be limited by the torque in the vehicle, in which case it is affected by the same parameters as acceleration.
Obstacle Traversal
In some cases, a vehicle will not have enough power to lift itself over some obstacles. However, in most cases, the geometry of the wheels and chassis will prevent traversal. For example, the chassis might hit the obstacle before wheels reach it, or the wheel diameter is small enough that it falls into a ditch rather than pass over.
Stability (Dive/Roll/Tip)
Stability (how much a vehicle rolls or tilts, or when it tips over) is mostly determined by mass and geometry. A vehicle with a high center of mass and small footprint will tilt and tip more easily.
Tuning Procedure
Ultimately, the performance of a vehicle model is determined by the properties and parameters of the model. Those properties can come from two different places: they are either directly known or measured, or they are derived from performance tests. Ultimately, it is performance tests that will determine if the vehicle is behaving accurately, but if the parameters are known in the beginning, tuning becomes much easier.
Tuning the vehicle is like solving a crossword puzzle: the more things that are known for certain, the easier it is to fill in the uncertainties. The dependencies grid above can act as a guide for this process. With that in mind, parameters that are known from provided or measured specs should obviously be added first, since this fills in information that is used to derive other parameters. After that, tests can be performed in an order that gradually fills in more information with the least ambiguity possible. However, there are many cases where tuning one property has an effect on many tests. In principle, the results should always be compatible, because it is a representation of a real system. But in practice, there are uncertainties in the parameters, incorrect impressions from user experiences, and imperfections in the model, and it might sometimes be necessary to compromise on some test results.
In order to eliminate the terrain properties from the process, all tests (unless specified) are performed on level, smooth concrete: no slope, no obstacles, no rolling resistance, and average friction which will not slip under acceleration.
Tests That Should Be Done in Order
- Top speeds (governed): This depends only on max RPM, gear ratios and wheel radius. These might all be known, in which case the test is a simple validation that the parameters are consistent. If any are not known, they can be derived from the test.
- Coasting: If possible, this test can be performed in neutral and in gear. The neutral test will give results that can be used to tune the aerodynamic drag, and drag in the wheels (if used). Once that is tuned, the test in gear can be used to tune drive train friction. If only one of the tests is performed, it might not be possible to separate the effects of aerodynamic drag and drive train friction, so it might be simplest to use only drive train friction.
- Acceleration: Once the previous parameters are set, acceleration tests can be used to derive the drive train efficiency.
- Braking: In theory, braking torque can be derived from the braking test. In practice, the wheels are already locked up and adding more braking torque has limited effect. It can change the braking distance by causing the wheels to lock sooner under hard braking. Beyond this, only material friction will affect the braking distance.
Tests That Do Not Need to Be Performed in Order
- Top speed (power limited): The parameters required to change this are mostly fixed by the previous tests, so this is not easy to tune directly. What can be modified is how the drive train friction and efficiency scale at different speeds. For example, in order to reduce the top speed, drive train damping could be raised at high speeds and lowered at low speeds without changing the overall acceleration rate or coasting time.
- Creep speed: Tuning this to the right speed might require changing values that are already set in order to get the right acceleration or coasting performance. However, as with the top speed (power limited) test, it might be possible to adjust the bottom range of the drive train friction to affect the creep speed. Also, the engine torque table at or below the idle speed can be safely modified without affecting other behavior, and it is often undefined in the provided specs.
- Slope climbing: What to tune to affect slope climbing depends on what limits the slope climbing, which should be known by the vehicle operator. If the vehicle tips over, the center of mass or suspension parameters should be changed. If the vehicle loses traction, only terrain friction will have an effect. If the vehicle runs out of power, drive train friction and efficiency could be changed, but that will also affect acceleration. Certain vehicles might have other parameters that would affect this, such as torque converter multiplication.
- Obstacle traversal: As with slope climbing, the critical tuning parameter depends on how the vehicle should fail when climbing an obstacle. If the vehicle should be hung up when crossing an obstacle, then changing anything that affects ride height will have an effect (mass, wheel radius, suspension stiffness), but those parameters are also likely to change other behavior. Adding collision geometries under the vehicle is often a simple (and probably accurate) solution. It is also possible that obstacle performance is limited by vehicle torque or friction, but this is difficult to affect without modifying other behavior.
- Stability: Stability is mostly tuned by adjusting the suspension parameters, but if things like center of mass or wheel radius change, stability will also be affected. There is not a single test to validate stability, but some common tests are double lane change maneuvers, or amount of suspension sinkage when the vehicle is loaded, or what level of side slope would cause the vehicle to tip over.
Tests That Are Not Strongly Interrelated to Others
- Tuning Radius: The turning radius of the vehicle is primarily determined by the maximum steered wheel angle (for wheeled vehicles) or the track speed ratio (for tracked vehicles). It could be that the steering angle (or speed ratio) of the vehicle is known, and the turning radius is given. In this case, it is still best to tune the steering angle (or speed ratio) to match the desired result, even if it is slightly different from the known spec.
The turning radius test (simply driving forward with maximum steering input) should be performed at low speed to avoid slipping sideways due to centripetal force. - Retarder: A retarder can exist on either side of the transmission. On the wheel side, the retarding torque increases with higher wheel speed. On the engine side, it increases with higher engine speed. Retarders are modeled by applying a braking torque on the shaft, where the torque is calculated from a polynomial related to the shaft speed.
Sometimes the maximum power of the retard is known, in which case the coefficients can be calculated to produce the maximum power at the maximum speed of the shaft. If the maximum power isn't known, the behavior must be tuned based on a test of a vehicle either decelerating or descending a slope with the retarder engaged. - Torque Converter: The coupling force of the torque converter in Vortex is related to the square of the engine rotational velocity. At low RPMs, there is little torque and it allows the engine to spin without stalling. As the engine speed increases, this torque increases until it prevents the engine from spinning any faster. By default, the point at which this happens (the stall speed) is at the maximum torque of the engine torque curve. This is a good approximation if no more information is known about the engine, but it is possible to adjust this for different behavior. The torque converter scale factor can be increased in order to make the torque converter couple more quickly at a lower RPM (or the opposite).
A torque converter also has torque multiplication, which is set using a table related to RPM. This affects the amount of torque available to the vehicle at low speeds, and is generally between 1.5 and 2.5.
Many modern vehicles also have a locking system in the torque converter to prevent slip at high speeds and increase efficiency. If this is the case, it is necessary to write a script that controls the lock torque based on the conditions that cause the torque converter to lock (e.g., lock when shifting up to a certain gear, unlock when RPM is reduced below a certain value). - Gear Shifting: The delay between successive gear shifts can be set according to real vehicle behavior. It can have an effect on acceleration performance if the delay is long, but that should be uncommon.
- Engine Throttle Delay: Engines in Vortex respond instantly by default, though in reality some engines take a small amount of speed to get to full torque. This can be set in the Vortex vehicle, in order to get a similar feel to the real vehicle.
- Throttle and Brake Scaling: In some vehicles, the throttle pedal and brake pedal hardware do not directly scale to the Vortex vehicle input signals. For example, the brake pedal might engage the retarder from 0 to 50%, then the braking system from 50% to 100%. This can be programmed into a script that controls the throttle input.
Engine Torque Table Tuning
Note The tables on this page are high level examples produced from a modified version of a spreadsheet included in the Vortex® Studio Demo Scenes (Generic_TT_EB.xlsx). Some values have been altered to better illustrate the concepts. You can view the raw data here.
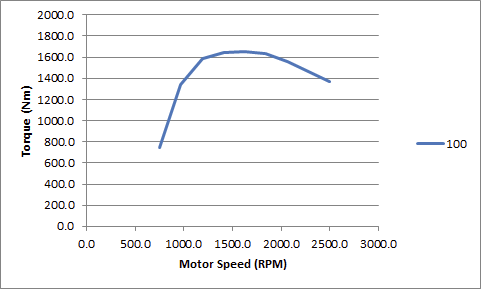
An engine torque curve is available for most vehicles, but it does not contain enough information to completely describe the engine in Vortex Studio. For example, most curves do not include torque and throttle positions other than 100%. The other necessary information can be extrapolated based on some reasonable assumptions.
The torque curve provided for the vehicle generally only includes the torque at full throttle between idle and maximum RPM.
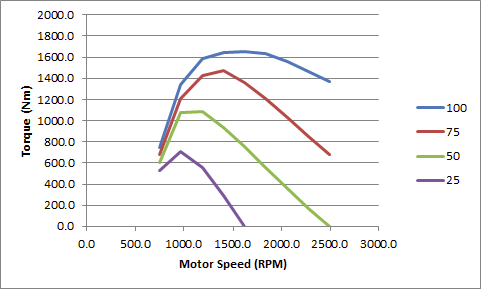
Since a vehicle can also be operated at lower throttle positions, those torques must be provided. Every engine has different throttle performance, and the throttle system itself might have a particular scaling. However, the general shape of the 100% curves below is usually similar for all engines. At low RPM, the low throttle curves will follow the torque of the full throttle curve, but at higher RPM will decrease and approach 0 torque. This behavior, captured on a spreadsheet, can be used to generate a more complete engine torque table.
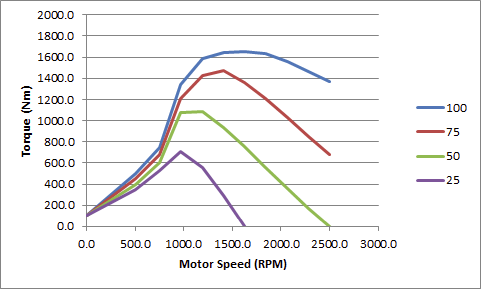
A vehicle must also function correctly below idle speed, since it can be in this range when starting or when the torque converter pushes it below idle. Little is known about behavior in this region, so the curve is just linearly extended to 0 RPM. In a real engine, the torque would reach 0 torque (and stall) at some RPM above 0 but since the starter system is not modeled in Vortex Studio, the engine torque has to always be positive to allow the engine to spin up when initially started.
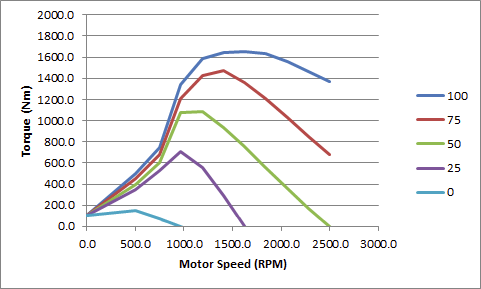
Finally, a curve is needed for 0 throttle. It is expected that there is no positive torque when the throttle is at 0, but an engine does generate a positive torque below idle speed. A default value for this part of the curve is also provided by the spreadsheet, but it can be tuned to change the behavior of the vehicle creeping. When the transmission is engaged, the vehicle will generally roll forward slowly, which puts some load on the engine and pushes the RPM below idle.
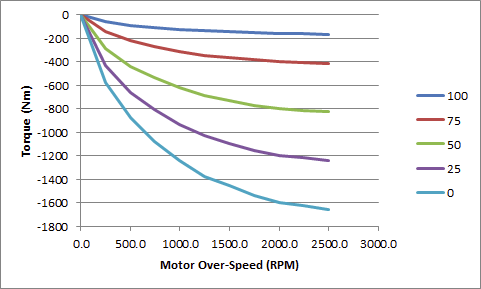
An important concept relates to where the throttle curve reaches 0 torque; for example, at 25% throttle, the engine will not produce any torque above 1700 RPM. This is the point where the engine will not try to spin faster at a given throttle position. If the engine speed is raised above this speed (which can only happen when decelerating or driving down a slope), it is overspeeding, and will produce a negative torque. This engine braking amount is usually not known for a vehicle, but the general shape can be derived based on the size of the engine, and is calculated in a table.
Automatic Transmission Shift Point Tuning
Note The tables on this page are high level examples used for illustrative purposes only. You can view the raw data here.
In an automatic transmission, predefined points determine when the transmission will shift up (higher gear number, faster speed, lower gear ratio) or down. Generally, transmission shift points are easy to read and are often known but in some cases, they are not. It is nevertheless important to confirm that these shifting points are internally consistent.
There are three rules to consider about tuning shifting points:
- Shift up below the maximum RPM.
- Shift down above the idle RPM.
- The up and downshift points must be far enough apart that the new RPM after shifting up is not lower than the downshift point (and vice versa).
The first two rules are fairly obvious. The third rule is needed to avoid the case where a vehicle shifts up, the RPM is reduced in the new gear, then the vehicle shifts back down, starting an infinite cycle of up and downshifting.
It is simple to check whether there is enough space between up and downshifting points using a simple relation between the RPM before and after a shift:
![]()
After shifting up, the New RPM should be higher than the downshift point in the new gear.
Many vehicles have two sets of up and downshift points, one ("normal") that is active at most throttle positions, another higher set (often called "quick shift") used when the throttle is near 100%. The quick shift is used under hard acceleration to help the vehicle stay in a higher RPM range, where the engine generally has more power.
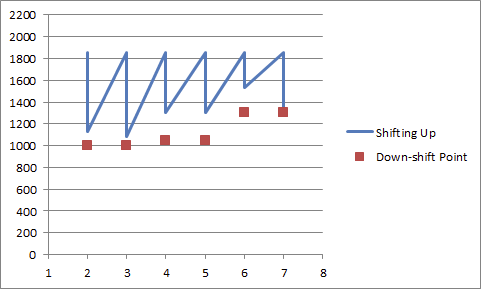
There is no exact formula for where shifts should happen (besides the rules above). But as a guideline, the normal shifting should be set so that the downshift points are somewhat above the idle RPM, and if possible, above any region of very low torque. Then the upshift point would be relatively high enough according to rule 3. In the example below, a vehicle has an idle RPM of 750 and max RPM of 2200. Upshifting is set for 1850 RPM for all gears.
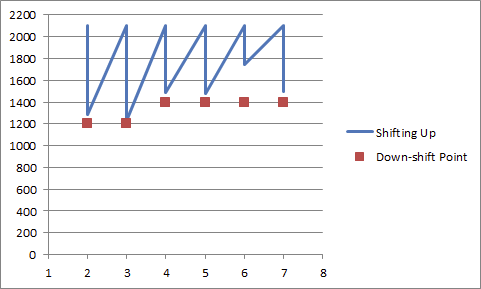
For quick shifting, the upshift points should be close to the maximum RPM of the engine. In this example, that is 2100 RPM. The downshift point is also raised, but cannot be higher than RPM after shifting.
It is possible for an automatic transmission to cycle between gears in certain situations. When under heavy load (e.g., pulling or carrying a heavy load, climbing a hill), a vehicle might shift into a gear where there is not enough engine torque to maintain the speed. This could cause the automatic transmission to shift down. Once in the lower gear, the vehicle might have enough torque to accelerate to the up-shift point, causing the transmission to shift back into the higher gear again.
This is normal behavior and there is no way to completely avoid it in a vehicle that shifts automatically. The cycling will be at a slower frequency if the gap between the up and downshift points is larger, but cannot be removed. It is up to the operator to either control the throttle to avoid the situation, or set the transmission range to prevent shifting into the higher gear. This is why most vehicles have a gear selector that allows limiting the highest gear.