Graphical Simulation Plotter
- DEVOPS
The Plotter is a graphical interface that can display the data from the simulation to be used for debugging purposes.
The Plotter can be used to look for behaviors that cannot be detected by the visual simulation. The data can be exported to fine-tune the simulation and its parameters.
The Plotter supports inputs and outputs of reals, integers, boolean, vector3 and transformation values.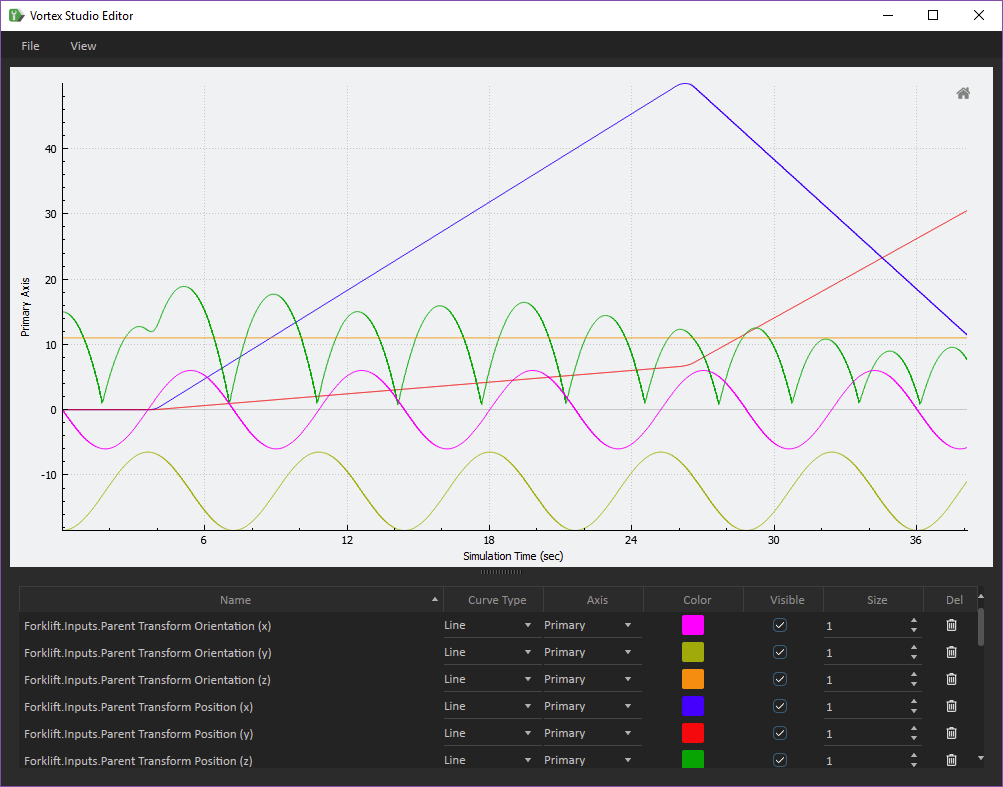
The Plotter contains the graphical display in the top frame with the names of the parameters displayed below. For each parameter, you can change the display axis, color, type of graph display (curve type), size of plots, visibility as well as delete the parameter from the plotter.
Warning In order to see plotted data, there MUST be a Metrics Manager module in your Application Setup file. To add one, open the Application Setup file and, in the Toolbox, select Modules, then double-click Metrics Manager.
During simulation, you can pause and use the step feature to collect data on the Plotter. You can also have multiple Plotters active in a simulation, monitoring different aspects of the simulation.
The data can be exported to a comma separated values file (CSV) for import to other tools for further analysis by selecting Export to CSV under the File menu.
Note If you stop the simulation and start another simulation, all data from the previous simulation will be removed from the Plotter.
Clicking the View button on the Plotter, you can customize the following:
- Y-Axis Setup allows you to set the maximum and minimum values for the Y-axis, or allow them to be set automatically based on the data in the Plotter.
- Customize the Data Display to show all data or specify a number of seconds to follow.
- Change the Refresh Rate from normal to fast.
- Change the value of the X-Axis Unit to frame number or simulation time.
- Toggle the Background color scheme from light to dark.
The Plotter can be configured to display pertinent data to debug and to fine-tune the simulation. Using the export function, you can use powerful tools to further examine the data.
Using the Plotter to Monitor Your Simulations
You can use the Plotter function in your simulations to provide feedback on the status of an object or group of objects.
The Plotter allows you to perform analysis of simulation values over time to confirm behavior, troubleshoot a model, and possibly debug the simulation.
The Plotter allows you to drag and drop parameters in the Plotter GUI and see real time statistics. This data can be exported to a CSV file for analysis outside the Vortex® simulator.
To open the Plotter in Vortex Studio Editor:
On the bottom-right of the 3D View, click the Plotter icon.
Drag inputs or outputs from the Properties view onto the Plotter window.
While the simulation is running or paused:- Click and drag in the window to pan through the data.
- Hold Ctrl and click and drag in the window to zoom into a specific area of the Plotter.
- Use the mouse wheel to zoom the Plotter in or out at the cursor's position in the window.
- Click the Home icon at the top-right of the Plotter to return to the default presentation of the data in the Plotter.
You can monitor the object's data output in real-time and export the data to a CSV file for further analysis outside of the editor. You can also use multiple plotters to monitor different aspects of the simulation.
Note If you remove one component of a vector3 parameter, all the components of that vector3 will be removed from the plotter.
Exporting Plotter Data to a CSV File
Using the Plotter, you can graph parameters to the dynamic Plotter for analysis.
You can export the data collected to a comma separated value file (CSV).
This data can be exported to additional programs for further analysis or viewing.
In the Plotter, add the parameters to be graphed and run the simulation.
In the Plotter window, click File > Export to CSV button.
Select a location and name for the file.
Graphical Profiler Debug Panel
The Profiler interface of the Editor provides an approximate value of the simulation's performance using a graphical interface.
The Profiler provides information on the resources that the simulation is using which allows you to adjust the simulation and see the resulting effect in real time.
Note The values listed are approximate because the Editor is not designed for full real-time simulation. The user interface and the display itself have a non-negligible overhead. Also, the percentage displayed in the Duration column should only be viewed as an estimate; the sum of the sub-sections is not 100% as there is no guarantee that the entire code execution is measured.
To activate the Profiler:
- In Vortex® Studio Editor, click
 then Profiler.
 - In the Profiler panel, expand the names of the actions and select the events that the Profiler will monitor. Note, you might be required to hit the Refresh button to see all events.
- Click OK.
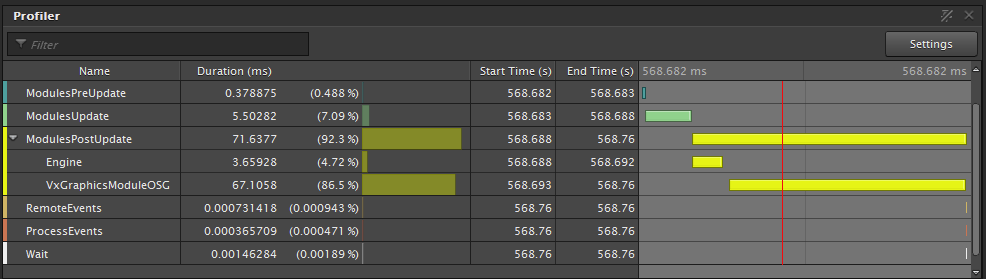
The Profiler displays the name, duration, start and end times each event consumes. The Profiler also displays a red line to display the optimal 60 frames per second. Click the Settings button to add or remove additional events.
There exists a more complete Profiler available in Vortex Studio Player.