The Profiler Panel
- DEVOPS
Profiler Overview
The Profiler allows the user to visualize the performance of simulation resources such as modules, listeners, cleanup loops etc. and specific simulation variables (e.g. data size, object count, executed function count etc.) that the simulation is using. The user can verify the overall performance of simulation modules all together, or the user can enable or disable the desired modules and/or variables and see the resulting effect in real-time.
The Vortex Editor's graphical profiler is used for diagnosing performance problems. It is recommended to use Vortex Player application that has features that are designed specifically for investigating the problems (Performance Analysis).
Accessing the Profiler
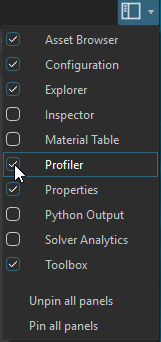
To view the Profiler panel, click the top-right drop-down button on the toolbar in the Vortex Editor and select the Profiler
Working with the Profiler
The Profiler includes two main interfaces known as the Settings view and the Profiling view:
- The Settings view is the default view when the Profiler is opened. The view by default gives an overview of top level profiling resources. The user can expand the selected or all the top level resources in tree view to see more resource breakdowns. It allows the user to select the desired resource for profiling.
- The Profiling view allows the user to graphically view and to diagnose the performance of the selected resources. The users can evaluate the performance by examine the discrete values or the graphs.
The default view is the Settings view, to activate the profiling view, click OK button ![]() on the toolbar. When the Profiling view is active, to go back to the Settings view, click Settings button
on the toolbar. When the Profiling view is active, to go back to the Settings view, click Settings button ![]() on the toolbar. The following sections will detail the features of each view.
on the toolbar. The following sections will detail the features of each view.
Setting resources for profiling
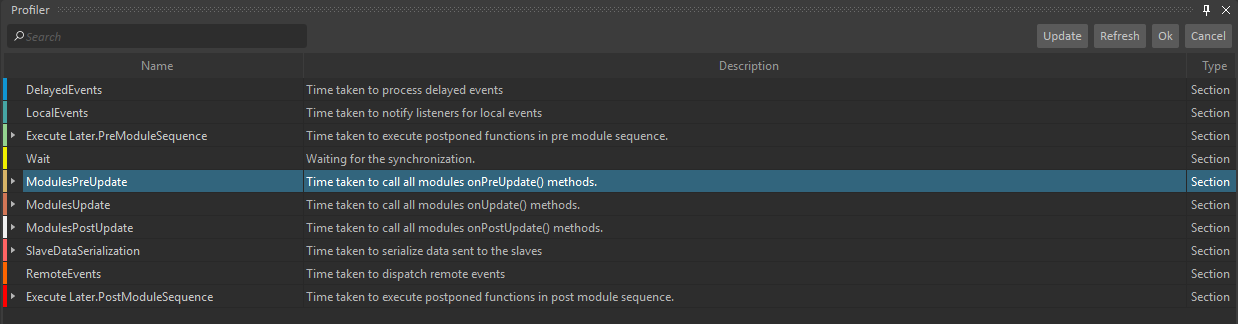
The Settings view displays a list of simulation resources such as modules, listeners, cleanup loop etc. and specific simulation variables (e.g. data size, object count, executed function count etc.).
Toolbar
| Search the resources that match the specified keywords |
| Discover new resources without clearing the current resources. |
| Clear the currently discovered resources and discover new ones. |
| Accept the selected resources and navigate to the profiling view. |
| Reject the newly selected resources and navigate to the profiling view. |
List View
| Name |
| Read-only color legend to indicate the specific color that is used for displaying the color graph of specific resource. The color graphs are shown in the Profiling view. Note that it is not possible to change the color legend, the colors are predefined by the panel. |
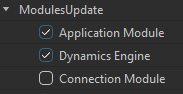
| Expand & Collapse buttons that are use to expand or collapse the tree view to see all resources that can be individually selected for profiling. | |
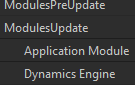
| The main resource name and its sub-resource names in the tree view. This view shows all available resources that can be selected for profiling. | |
| Description | The detailed description of the resource. | |
| Type | Profiling type; section type (modules, listeners, cleanup loop etc.) or discrete value type (data size, object count, executed function count etc.) | |

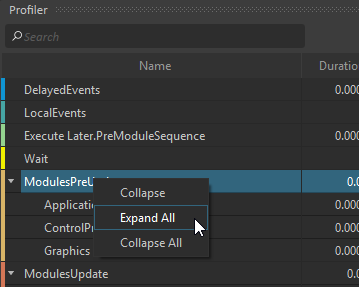
Settings View's popup menu
Right-click on a row to select the row and display the menu
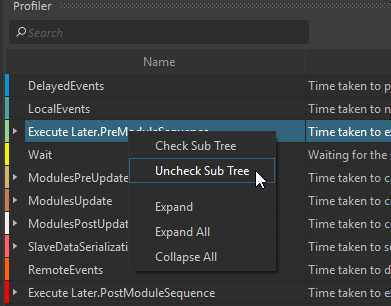
| Check Sub Tree | Check all sub-items of the selected item. |
| Uncheck Sub Tree | Uncheck all sub-items of the selected item. |
| Expand/Collapse | Collapse or expand all sub-resources of the selected row. |
| Expand All | Expand all resources in the name column. |
| Collapse All | Collapse all resources in the name column. |
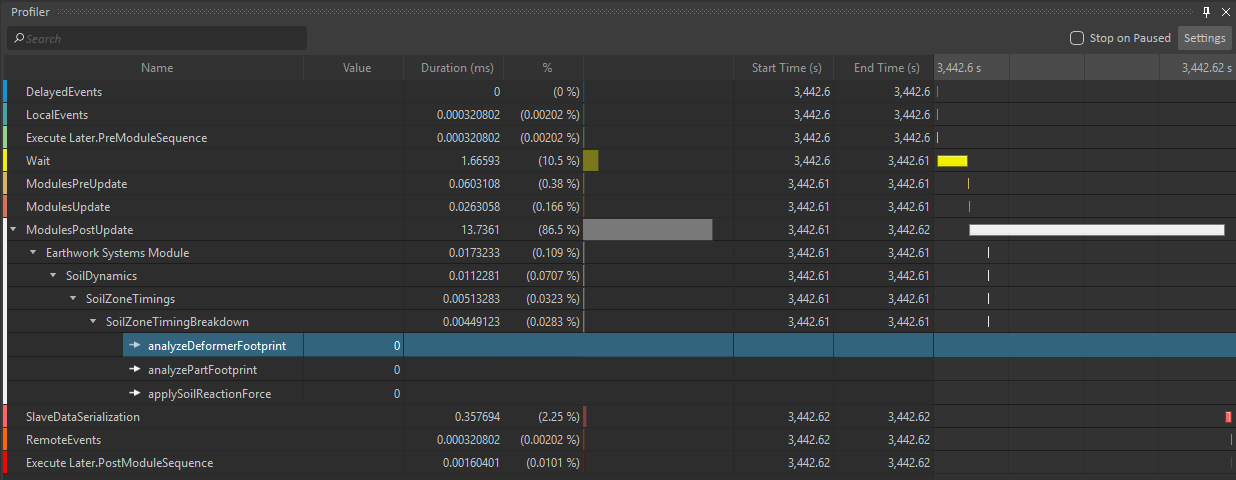
Profiling View
To view the Inspector panel, click ![]() on the Settings view's toolbar.
on the Settings view's toolbar.
Toolbar
| Search the resources that match the specified keywords |
| If the button is checked, when a simulation is paused, the profiler view stops updating to allow the users to view the results. |
| Click to navigate back to the Settings view. |
List View
| Name |
| Read-only color legend to indicate the specific color that is used for displaying the color graph of specific resource. The color graphs are shown in the Profiling view. |
| Expand & Collapse buttons that are use to expand or collapse the tree view to see all resources that can be individually selected for profiling. | |
| The resource name and its selected sub-resource names for profiling and their corresponding color graphs are shown in the view. These are read-only, in order to disable profiling of the resources use the Setting buttons on the toolbar to go back to the settings view. | |
| Value | Discrete values of simulation variables such as data size, object count, executed function count etc. | |
| Duration (ms) | Approximate step time in milliseconds of the simulation modules, listeners, cleanup loop etc. | |
| % column | Approximate percentage of the overall performance. The graph with specific color is also shown. | |
| Start time (s) | The start of the step time in seconds of the section resources (e.g. modules, listeners, cleanup loop etc.) | |
| End time (s) | The end of the step time in seconds of the section resources (e.g. modules, listeners, cleanup loop etc.) | |
| Percentage graph and elapsed time graph. The graph also displays a red line to display the optimal 60 frames per second. | |

Profiling View's popup menu
Right-click on a row to select the row and display the menu
| Expand/Collapse | Collapse or expand all sub-resources of the selected row. |
| Expand All | Expand all resources in the name column |
| Collapse All | Collapse all resources in the name column |